Tropical cyclone basins

Last updated
Official tropical cyclone basins Tropical Cyclone Centers and Regions.png
Official tropical cyclone basins

Traditionally, areas of tropical cyclone formation are divided into seven basins. These include the north Atlantic Ocean, the eastern and western parts of the northern Pacific Ocean, the southwestern Pacific, the southwestern and southeastern Indian Oceans, and the northern Indian Ocean (Arabian Sea and Bay of Bengal). The western Pacific is the most active and the north Indian the least active. An average of 86 tropical cyclones of tropical storm intensity form annually worldwide, with 47 reaching hurricane/typhoon strength, and 20 becoming intense tropical cyclones, super typhoons, or major hurricanes (at least of Category 3 intensity). [1]

Contents

Overview

Tropical cyclone basins and official warning centre.
BasinWarning CenterArea of responsibilityRefs
Northern Hemisphere
North Atlantic
Eastern Pacific
United States National Hurricane Center
United States Central Pacific Hurricane Center
Equator northward, African Coast – 140°W
Equator northward, 140°W-180
[2]
Western Pacific Japan Meteorological Agency Equator-60°N, 180-100°E [3]
North Indian Ocean India Meteorological Department Equator northward, 100°E-45°E
Southern Hemisphere
South-West Indian Ocean Meteo France ReunionEquator-40°S, African Coast-90°E [4]
Australian region Badan Meteorologi, Klimatologi, dan Geofisika
Papua New Guinea National Weather Service
Australian Bureau of Meteorology
Equator-10°S, 90°E-141°E
Equator-10°S, 141°E-160°E
10°S-36°S, 90°E-160°E
[5]
Southern Pacific Fiji Meteorological Service
Meteorological Service of New Zealand
Equator-25°S, 160°E-120°W
25°S-40°S, 160°E-120°W
[5]

Northern Hemisphere

North Atlantic Ocean

Tracks of all tropical cyclones in the northern Atlantic Ocean between 1980 and 2005 Atlantic hurricane tracks 1980-2005.jpg
Tracks of all tropical cyclones in the northern Atlantic Ocean between 1980 and 2005

This region includes the North Atlantic Ocean, the Caribbean Sea, and the Gulf of Mexico. Tropical cyclone formation here varies widely from year to year, ranging from one to over twenty-five per year. [6] Most Atlantic tropical storms and hurricanes form between June 1 and November 30. The United States National Hurricane Center (NHC) monitors the basin and issues reports, watches and warnings about tropical weather systems for the Atlantic Basin as one of the Regional Specialized Meteorological Centres for tropical cyclones as defined by the World Meteorological Organization. [7] On average, 14 named storms (of tropical storm or higher strength) occur each season, with an average of 7 becoming hurricanes and 3 becoming major hurricanes. The climatological peak of activity is around September 10 each season. [8]

The United States Atlantic coast and Gulf Coast, Mexico, Central America, the Caribbean Islands, and Bermuda are frequently affected by storms in this basin. Venezuela, the 4 provinces of Atlantic Canada, and Atlantic Macaronesian islands also are occasionally affected. Many of the more intense Atlantic storms are Cape Verde-type hurricanes, which form off the west coast of Africa near the Cape Verde islands. Occasionally, a hurricane that evolves into an extratropical cyclone can reach western Europe, including Hurricane Gordon, which spread high winds across Spain and the British Isles in September 2006. [9] Hurricane Vince, which made landfall on the southwestern coast of Spain as a tropical depression in October 2005, and Subtropical Storm Alpha, which made landfall on the coast of Portugal as a subtropical storm in September 2020, are the only known systems to impact mainland Europe as a (sub)tropical cyclone in the NHC study period commencing in 1851 [10] (it is believed a hurricane made landfall in Spain in 1842). [11]

Northeastern Pacific Ocean

Tracks of all tropical cyclones in the northern Pacific Ocean east of the International Date Line between 1980 and 2005; the vertical line through the center separates the Central Pacific basin (under the Central Pacific Hurricane Center's watch) from the Northeastern Pacific basin (under the National Hurricane Center's area of responsibility). Pacific hurricane tracks 1980-2005.jpg
Tracks of all tropical cyclones in the northern Pacific Ocean east of the International Date Line between 1980 and 2005; the vertical line through the center separates the Central Pacific basin (under the Central Pacific Hurricane Center's watch) from the Northeastern Pacific basin (under the National Hurricane Center's area of responsibility).

The Northeastern Pacific is the second most active basin and has the highest number of storms per unit area. The hurricane season runs between May 15 and November 30 each year, and encompasses the vast majority of tropical cyclone activity in the region. [12] In the 1971–2005 period, there were an average of 15–16 tropical storms, 9 hurricanes, and 4–5 major hurricanes (storms of Category 3 intensity or greater) annually in the basin. [12]

Storms that form here often affect western Mexico, and less commonly the Continental United States (in particular California), or northern Central America. No hurricane included in the modern database has made landfall in California; however, historical records from 1858 speak of a storm that brought San Diego winds over 75 mph (65 kn; 121 km/h) (marginal hurricane force), though it is not known if the storm actually made landfall. [13] Tropical storms in 1939, 1976. 1997 and 2023 brought gale-force winds to California. [13]

The Central Pacific Hurricane Center's area of responsibility (AOR) begins at the boundary with the National Hurricane Center's AOR (at 140  °W), and ends at the International Date Line, where the Northwestern Pacific begins. [14] The hurricane season in the North Central Pacific runs annually from June 1 to November 30; [15] The Central Pacific Hurricane Center monitors the storms that develop or move into the defined area of responsibility. [14] The CPHC previously tasked with monitoring tropical activity in the basin was originally known as the Joint Hurricane Warning Center; today it is called the Joint Typhoon Warning Center.

Central Pacific hurricanes are rare and on average 4 to 5 storms form or move in this area annually. [15] As there are no large contiguous landmasses in the basin, direct hits and landfalls are rare; however, they occur occasionally, as with Hurricane Iniki in 1992, which made landfall on Hawaii, [16] and Hurricane Ioke in 2006, which made a direct hit on Johnston Atoll. [17]

Northwestern Pacific Ocean

Tracks of all tropical cyclones in the northwestern Pacific Ocean between 1980 and 2005. The vertical line to the right is the International Date Line. Pacific typhoon tracks 1980-2005.jpg
Tracks of all tropical cyclones in the northwestern Pacific Ocean between 1980 and 2005. The vertical line to the right is the International Date Line.

The Northwest Pacific Ocean, or Western North Pacific, is the most active basin on the planet, accounting for one-third of all tropical cyclone activity. Annually, an average of 25.7 tropical cyclones in the basin acquire tropical storm strength or greater; also, an average of 16 typhoons occurred each year during the 1968–1989 period. [6] [ needs update ] The basin occupies all the territory north of the equator and west of the International Date Line, including the South China Sea. [14] The basin sees activity year-round; however, tropical activity is at its minimum in February and March. [18]

Tropical storms in this region often affect China, Hong Kong, Japan, the Koreas, Macau, Philippines, Taiwan and Vietnam, plus numerous Oceanian islands such as Guam, the Northern Marianas and Palau. Sometimes, tropical storms in this region are powerful and long lasting enough enough to affect the more inland South East Asian nations of Laos, Thailand, and Cambodia, and in extreme cases, even the equatorial nations of Singapore, Brunei, Malaysia, and Indonesia. The coast of China sees the most landfalling tropical cyclones worldwide. [19] The Philippines receives an average of 6–7 tropical cyclone landfalls per year, [20] with typhoons Haiyan and Goni in 2013 and 2020 being the strongest and most powerful landfalling storms to date. [21]

North Indian Ocean

Tracks of all tropical cyclones in the northern Indian Ocean between 1980 and 2005 North Indian Ocean cyclone tracks 1980-2005.jpg
Tracks of all tropical cyclones in the northern Indian Ocean between 1980 and 2005

This basin is divided into two areas: the Bay of Bengal and the Arabian Sea, with the Bay of Bengal dominating (5 to 6 times more activity). Still, this basin is the least active worldwide, with only 4 to 6 storms per year.

This basin’s season has a double peak: one in April and May, before the onset of the monsoon, and another in October and November, just after. [22] This double peak occurs because powerful vertical wind shear in between the surface monsoonal low and upper tropospheric high during the monsoon season tears apart incipient cyclones. [23] High shear explains why no cyclones can form in the Red Sea, which possesses the necessary depth, vorticity and surface temperatures year-round. Rarely do tropical cyclones that form elsewhere in this basin affect the Arabian Peninsula or Somalia; however, Cyclone Gonu caused heavy damage in Oman on the peninsula in 2007.

Although the North Indian Ocean is a relatively inactive basin, extremely high population densities in the Ganges and Ayeyarwady Deltas mean that the deadliest tropical cyclones in the world have formed here, including the 1970 Bhola cyclone, which killed 500,000 people. Nations affected include India, Bangladesh, Sri Lanka, Thailand, Myanmar, and Pakistan.

Mediterranean Sea

Image of the January 1995 system Mediterranean Hurricane 16 Jan 1995.jpg
Image of the January 1995 system

On rare occasions, tropical-like systems that can reach the intensity of hurricanes, occur over the Mediterranean Sea. Such a phenomenon is called a Medicane (Mediterranean-hurricane). Although the geographical dimensions of tropical oceans and the Mediterranean Sea are clearly different, the precursor mechanisms of these perturbations, based on the air-sea thermodynamic imbalance, are similar. [24] Their origins are typically non-tropical, and develop over open waters under strong, initially cold-core cyclones, similar to subtropical cyclones or anomalous tropical cyclones in the Atlantic Basin, like Karl (1980), Vince (2005), Grace (2009), Chris (2012), or Ophelia (2017). [25] Sea surface temperatures in late-August and early-September are quite high over the basin (24/28 °C or 75/82 °F), though research indicates water temperatures of 20 °C (68 °F) are normally required for development. [26]

Meteorological literature document that such systems occurred in September 1947, September 1969, January 1982, September 1983, January 1995, October 1996, September 2006, November 2011, November 2014, and November 2017. [27] [28] The 1995 system developed a well-defined eye, and a ship recorded 85 mph (140 km/h) winds, along with an atmospheric pressure of 975 mbar. Although it had the structure of a tropical cyclone, it occurred over 61 °F (16 °C) water temperatures, suggesting it could have been a polar low. [29]

Southern Hemisphere

Within the Southern Hemisphere tropical cyclones generally form on a regular basis between the African coast and the middle of the South Pacific. Tropical and Subtropical Cyclones have also been noted occurring in the Southern Atlantic Ocean at times. For various reasons including where tropical cyclones form, there are several different ways to split the area between the American and African coasts. For instance the World Meteorological Organization define three different basins for the tracking and warning of tropical cyclones. These are the South-West Indian Ocean between the African Coast and 90°E, the Australian region between 90°E and 160°E and the South Pacific between 160°E and 120°W. The United States Joint Typhoon Warning Center also monitors the whole region, but splits it at 135°E into the South Pacific and the Southern Indian Ocean.

South-West Indian Ocean

Tracks of all tropical cyclones in the southwestern Indian Ocean between 1980 and 2005 Southwest Indian Ocean cyclone tracks 1980-2005.jpg
Tracks of all tropical cyclones in the southwestern Indian Ocean between 1980 and 2005

The South-West Indian Ocean is located within the Southern Hemisphere between the Africa's east coast and 90°E and is primarily monitored by the Meteo France's La Reunion RSMC, while the Mauritian, Australian, Indonesian, and Malagasy weather services also monitor parts of it. [30] Until the start of the 1985–86 tropical cyclone season the basin only extended to 80°E, with the 10 degrees between 80 and 90E considered to be a part of the Australian region. [31] On average about 9 cyclones per year develop into tropical storms, while 5 of those go on to become tropical cyclones that are equivalent to a hurricane or a typhoon.

Australian region

Tracks of all tropical cyclones in the southeastern Indian Ocean between 1980 and 2005 Southeast Indian Ocean cyclone tracks 1980-2005.jpg
Tracks of all tropical cyclones in the southeastern Indian Ocean between 1980 and 2005

Through the middle of 1985, this basin extended westward to 80°E. Since then, its western boundary has been 90°E. [31] Tropical activity in this region affects Australia and Indonesia. According to the Australian Bureau of Meteorology, the most frequently hit portion of Australia is between Exmouth and Broome in Western Australia. [32] The basin sees an average of about seven cyclones each year, although more can form or come in from other basins, such as the South Pacific. [6] [33] [34] The tropical cyclone Cyclone Vance in 1999 produced the highest recorded speed winds in an Australian town or city at around 267 km/h (166 mph). [35]

South Pacific Ocean

Tracks of all tropical cyclones in the southwestern Pacific Ocean between 1980 and 2005 South Pacific cyclone tracks 1980-2005.jpg
Tracks of all tropical cyclones in the southwestern Pacific Ocean between 1980 and 2005

The South Pacific Ocean basin runs between 160°E and 120°W, with tropical cyclones developing in it officially monitored by the Fiji Meteorological Service and New Zealand's MetService. [5] Tropical Cyclones that develop within this basin generally affect countries to the west of the dateline, though during years of the warm phase of El Niño–Southern Oscillation cyclones have been known to develop to the east of the dateline near French Polynesia. On average the basin sees nine tropical cyclones annually with about half of them becoming severe tropical cyclones.

South Atlantic Ocean

Tracks of named South Atlantic tropical and subtropical cyclones since 2004 South Atlantic hurricane tracks.png
Tracks of named South Atlantic tropical and subtropical cyclones since 2004

Cyclones rarely form in other tropical ocean areas, which are not formally considered tropical cyclone basins. Tropical depressions and tropical storms occur occasionally in the south Atlantic, and the only full-blown tropical cyclones on record were the Angola tropical storm in 1991, Hurricane Catarina in 2004, Tropical Storm Anita in 2010, Tropical Storm Iba in 2019, and Tropical Storm 01Q in 2021. The south Atlantic Ocean is not officially classified as a tropical cyclone basin by the World Meteorological Organization and does not have a designated regional specialized meteorological center (RSMC). However, beginning in 2011, the Brazilian Navy Hydrographic Center started to assign names to tropical and subtropical systems in this basin, when they have sustained wind speeds of at least 65 km/h (40 mph).

See also

Related Research Articles

<span class="mw-page-title-main">Tropical cyclone warnings and watches</span> Levels of alert issued to areas threatened by a tropical cyclone

Tropical cyclone warnings and watches are alerts issued by national weather forecasting bodies to coastal areas threatened by the imminent approach of a tropical cyclone of tropical storm or hurricane intensity. They are notices to the local population and civil authorities to make appropriate preparation for the cyclone, including evacuation of vulnerable areas where necessary. It is important that interests throughout the area of an alert make preparations to protect life and property, and do not disregard it on the strength of the detailed forecast track.

<span class="mw-page-title-main">Pacific hurricane</span> Mature tropical cyclone that develops within the eastern and central Pacific Ocean

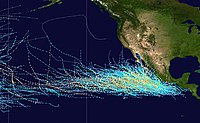
A Pacific hurricane is a tropical cyclone that develops within the northeastern and central Pacific Ocean to the east of 180°W, north of the equator. For tropical cyclone warning purposes, the northern Pacific is divided into three regions: the eastern, central, and western, while the southern Pacific is divided into 2 sections, the Australian region and the southern Pacific basin between 160°E and 120°W. Identical phenomena in the western north Pacific are called typhoons. This separation between the two basins has a practical convenience, however, as tropical cyclones rarely form in the central north Pacific due to high vertical wind shear, and few cross the dateline.

<span class="mw-page-title-main">Atlantic hurricane</span> Tropical cyclone that forms in the Atlantic Ocean

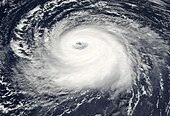
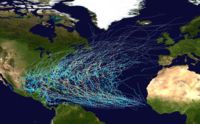
An Atlantic hurricane is a type of tropical cyclone that forms in the Atlantic Ocean primarily between June and November. The terms "hurricane", "typhoon", and "cyclone" can be used interchangeably to describe this weather phenomenon. These storms are rotating, organized systems of clouds and thunderstorms that originate over tropical or subtropical waters and have closed low-level circulation, not to be confused with tornadoes. They form over low pressure systems. In the North Atlantic, central North Pacific, and eastern North Pacific, the term "hurricane" is mainly used, whereas "typhoon" is more commonly used for storms originating in the western North Pacific. The term "cyclone" is used in the South Pacific and Indian Ocean.

<span class="mw-page-title-main">Tropical cyclogenesis</span> Development and strengthening of a tropical cyclone in the atmosphere

Tropical cyclogenesis is the development and strengthening of a tropical cyclone in the atmosphere. The mechanisms through which tropical cyclogenesis occurs are distinctly different from those through which temperate cyclogenesis occurs. Tropical cyclogenesis involves the development of a warm-core cyclone, due to significant convection in a favorable atmospheric environment.

<span class="mw-page-title-main">South-West Indian Ocean tropical cyclone</span>

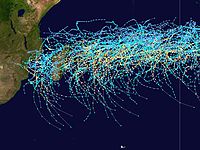
In the south-west Indian Ocean, tropical cyclones form south of the equator and west of 90° E to the coast of Africa.

<span class="mw-page-title-main">1973 North Indian Ocean cyclone season</span> Tropical cyclone season

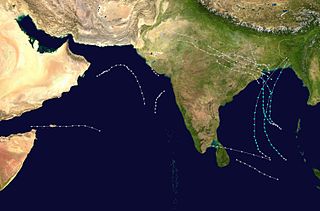
The 1973 North Indian Ocean cyclone season was part of the annual cycle of tropical cyclone formation. The season has no official bounds but cyclones tend to form between April and December. These dates conventionally delimit the period of each year when most tropical cyclones form in the northern Indian Ocean. There are two main seas in the North Indian Ocean—the Bay of Bengal to the east of the Indian subcontinent and the Arabian Sea to the west of India. The official Regional Specialized Meteorological Centre in this basin is the India Meteorological Department (IMD), while the Joint Typhoon Warning Center (JTWC) releases unofficial advisories. An average of five tropical cyclones form in the North Indian Ocean every season with peaks in May and November. Cyclones occurring between the meridians 45°E and 100°E are included in the season by the IMD.

The following outline is provided as an overview of and topical guide to tropical cyclones:

<span class="mw-page-title-main">Tropical cyclones in 2010</span>

During 2010, tropical cyclones formed within seven different tropical cyclone basins, located within various parts of the Atlantic, Pacific and Indian Oceans. During the year, a total of 111 tropical cyclones developed, with 64 of them being named by either a Regional Specialized Meteorological Center (RSMC) or a Tropical Cyclone Warning Center (TCWC). The most active basin was the North Atlantic, which documented 19 named systems, while the North Indian Ocean, despite only amounting to five named systems, was its basin's most active since 1998. Conversely, both the West Pacific typhoon and East Pacific hurricane seasons experienced the fewest cyclones reaching tropical storm intensity in recorded history, numbering 14 and 8, respectively. Activity across the southern hemisphere's three basins—South-West Indian, Australian, and South Pacific—was spread evenly, with each region recording 7 named storms apiece. The southern hemisphere's strongest tropical cyclone was Cyclone Edzani, which bottomed out with a barometric pressure of 910 mbar in the South-West Indian Ocean. Nineteen Category 3 tropical cyclones formed, including four Category 5 tropical cyclones in the year. The accumulated cyclone energy (ACE) index for the 2010, as calculated by Colorado State University was 573.8 units.

<span class="mw-page-title-main">Tropical cyclones in 2005</span>

During 2005, tropical cyclones formed within seven different tropical cyclone basins, located within various parts of the Atlantic, Pacific and Indian Oceans. During the year, a total of 141 systems formed with 94 of these developing further and were named by the responsible warning centre. The strongest tropical cyclone of the year was Hurricane Wilma, which was estimated to have a minimum barometric pressure of 882 hPa (26.05 inHg). 2005 was above-average in terms of the number of storms. The most active basin in the year was the North Atlantic, which documented 28 named systems. The Western Pacific had an near-average season with 23 named storms. The Eastern Pacific hurricane season experienced an above-average number of tropical storm intensity systems, numbering 15. Activity across the southern hemisphere's three basins – South-West Indian, Australian, and South Pacific – was fairly significant, with the regions recording 23 named storms altogether, with the most intense Southern Hemisphere cyclone of the year, Cyclone Percy from the South Pacific Ocean basin peaking at 145 mph (235 km/h) and 900 millibars. Throughout the year, 28 Category 3 tropical cyclones formed, including eight Category 5 tropical cyclones in the year. The accumulated cyclone energy (ACE) index for the 2005, as calculated by Colorado State University was 899.6 units.

<span class="mw-page-title-main">Tropical cyclones in 2006</span>

Throughout 2006, 133 tropical cyclones formed in seven bodies of water known as tropical cyclone basins. Of these, 80 have been named, including two tropical cyclones in the South Atlantic Ocean, and a tropical cyclone in the Mediterranean Sea, by various weather agencies when they attained maximum sustained winds of 65 km/h (40 mph). The strongest storms of the year were Typhoon Yagi in the Western Pacific, and Cyclone Glenda of the Australian region. The deadliest and costliest storms of the year were a series of five typhoons that struck the Philippines and China; Chanchu, Bilis, Saomai, Xangsane, and Durian, with most of the damage being caused by Durian of November. So far, 27 Category 3 tropical cyclones formed, including five Category 5 tropical cyclones in the year. The accumulated cyclone energy (ACE) index for the 2006, as calculated by Colorado State University was 761 units.

<span class="mw-page-title-main">Tropical cyclones in 2018</span>

During 2018, tropical cyclones formed within seven different tropical cyclone basins, located within various parts of the Atlantic, Pacific and Indian Oceans. During the year, a total of 151 tropical cyclones had formed this year to date. 102 tropical cyclones were named by either a Regional Specialized Meteorological Center (RSMC) or a Tropical Cyclone Warning Center (TCWC).

<span class="mw-page-title-main">Tropical cyclones in 2004</span>

During 2004, tropical cyclones formed within seven different tropical cyclone basins, located within various parts of the Atlantic, Pacific and Indian Oceans. During the year, a total of 132 systems formed with 82 of these developing further and were named by the responsible warning centre. The strongest tropical cyclone of the year was Cyclone Gafilo, which was estimated to have a minimum barometric pressure of 895 hPa (26.43 inHg). The most active basin in the year was the Western Pacific, which documented 29 named systems, while the North Atlantic 15 named systems formed. Conversely, both the Eastern Pacific hurricane and North Indian Ocean cyclone seasons experienced a below average number of named systems, numbering 12 and 4, respectively. Activity across the southern hemisphere's three basins—South-West Indian, Australian, and South Pacific—was spread evenly, with each region recording seven named storms apiece. Throughout the year, 28 Category 3 tropical cyclones formed, including seven Category 5 tropical cyclones formed in the year. The accumulated cyclone energy (ACE) index for the 2004, as calculated by Colorado State University was 1024.4 units.

<span class="mw-page-title-main">Tropical cyclones in 2000</span>

During 2000, tropical cyclones formed in seven different areas called basins, located within various parts of the Atlantic, Pacific, and Indian Oceans. A total of 140 tropical cyclones formed within bodies of water known as tropical cyclone basins, with 81 of them being further named by their responsible weather agencies when they attained maximum sustained winds of 35 knots. The strongest storm of the year was Cyclone Hudah, peaking with a minimum pressure of 905 hPa (26.72 inHg), and with 10-minute sustained winds of 220 km/h (135 mph). The highest confirmed number of deaths from a storm was from Typhoon Kai-tak, which killed 188 people, however, Leon–Eline may have killed up to 722 people. The costliest storm was Saomai, which caused $6.3 billion in damage. The accumulated cyclone energy (ACE) index for the 2000, as calculated by Colorado State University was 677.3 units.

<span class="mw-page-title-main">Tropical cyclones in 1997</span>

The year 1997 was regarded as one of the most intense tropical cyclone years on record, featuring a record 12 category 5-equivalent tropical cyclones, according to the Saffir–Simpson hurricane wind scale. The year also featured the second-highest amount of accumulated cyclone energy (ACE) on record, just behind 1992 and 2018. Throughout the year, 108 tropical cyclones have developed in bodies of water, commonly known as tropical cyclone basins. However, only 89 tropical cyclones were of those attaining 39 mph or greater, falling just below the long term average of 102 named systems. The most active basin was the Western Pacific, attaining an ACE amount of 571, the highest ever recorded in any season in any basin on record. The deadliest tropical cyclone was Severe Tropical Storm Linda (Openg). The costliest tropical cyclone was Super Typhoon Winnie (Ibiang), which set a record for having the largest eye on record. The most intense tropical cyclone was Hurricane Linda, peaking at 902 hPa/mbar. Typhoon Paka (Rubing), the longest-lived system, produced the fourth-highest ACE for a single tropical cyclone, just behind Typhoon Nancy (1961), Hurricane/Typhoon Ioke (2006), and Cyclone Freddy (2023). The accumulated cyclone energy (ACE) index for the 1997, as calculated by Colorado State University was 1,099.2 units.

<span class="mw-page-title-main">Tropical cyclones in 1999</span>

During 1999, tropical cyclones formed within seven different bodies of water called basins. To date, 142 tropical cyclones formed in bodies of water known as tropical cyclone basins, of which 72 were given names by various weather agencies. The strongest tropical cyclone of the year was Gwenda, attaining maximum sustained winds of 120 knots and a pressure of 900 hPa (26.58 inHg), later tied with Inigo in 2003. Floyd was the costliest tropical cyclone of the year, with around $6.5 billion worth of damages as it affected the Bahamas, the East Coast of the United States, and the Atlantic Canada. The deadliest cyclone of this year was the 1999 Odisha cyclone, which was blamed for over 9,667 deaths as it devastated India. It was also the strongest Northern Hemisphere cyclone of the year with the pressure of 912 hPa (26.93 inHg) and third most intense tropical cyclone worldwide next to Cyclone Gwenda and Cyclone Vance. Three Category 5 tropical cyclones were formed in 1999. The accumulated cyclone energy (ACE) index for the 1999, as calculated by Colorado State University was 606.4 units.

<span class="mw-page-title-main">Tropical cyclones in 1996</span>

During 1996, tropical cyclones formed within seven different tropical cyclone basins, located within various parts of the Atlantic, Pacific, and Indian Oceans. During the year, a total of 139 tropical cyclones formed in bodies of water known as tropical cyclone basins. 90 of them were named by various weather agencies when they attained maximum sustained windS of 35 knots. The strongest tropical cyclone of the year was Cyclone Daniella, peaking with a pressure of 915 hPa (27.02 inHg) in the open waters of the Indian Ocean. Hurricane Fran and Typhoon Herb tie for the costliest storm of the year, both with a damage cost of $5 billion. The deadliest tropical cyclone of the year was the 1996 Andhra Pradesh cyclone, which was blamed for over 1,000 fatalities as it directly affected the state of Andhra Pradesh in India. Five Category 5 tropical cyclones were formed in 1996. The accumulated cyclone energy (ACE) index for the 1996, as calculated by Colorado State University was 960 units.

<span class="mw-page-title-main">Tropical cyclones in 1993</span>

During 1993, tropical cyclones formed within seven different bodies of water called basins. To date, 110 tropical cyclones formed, of which 78 were given names by various weather agencies. Only one Category 5 tropical cyclone was formed in 1993. The accumulated cyclone energy (ACE) index for the 1993, as calculated by Colorado State University was 710.4 units.

<span class="mw-page-title-main">Tropical cyclones in 2021</span>

During 2021, tropical cyclones formed in seven major bodies of water, commonly known as tropical cyclone basins. Tropical cyclones will be assigned names by various weather agencies if they attain maximum sustained winds of 35 knots. During the year, one hundred forty-five systems have formed and ninety-one were named, including one subtropical depression and excluding one system, which was unofficial. One storm was given two names by the same RSMC. The most intense storm of the year was Typhoon Surigae, with maximum 10-minute sustained wind speeds of 220 km/h (140 mph) and a minimum pressure of 895 hPa (26.43 inHg). The deadliest tropical cyclone was Typhoon Rai, which caused 410 fatalities in the Philippines and 1 in Vietnam, while the costliest was Hurricane Ida, which caused an estimated $75.25 billion USD in damage after striking Louisiana and the Northeastern United States. Six Category 5 tropical cyclones formed during the year, tying 2003. The accumulated cyclone energy (ACE) index for the 2021, as calculated by Colorado State University (CSU) was 621.1 units overall.

<span class="mw-page-title-main">Tropical cyclones in 2023</span> Tropical cyclones in 2023 worldwide

During 2023, tropical cyclones formed in seven major bodies of water, commonly known as tropical cyclone basins. They were named by various weather agencies when they attained maximum sustained winds of 35 knots. Throughout the year, a total of 115 systems formed, with 79 of them being named. The most intense storm this year was Typhoon Mawar, which had a minimum pressure of 900 hPa (26.58 inHg). The deadliest and costliest tropical cyclone of the year was Storm Daniel, which killed at least 10,028 people in Libya, Greece, Turkey, and Bulgaria, and caused at least US$21.14 billion worth of damage. Among this year's systems, thirty became major tropical cyclones, of which nine intensified into Category 5 tropical cyclones on the Saffir–Simpson scale (SSHWS). This year, for the first time on record, at least one such Category 5 system formed in each tropical cyclone basin: Typhoons Mawar and Bolaven in the western Pacific Ocean, Hurricanes Jova and Otis in the eastern Pacific, Hurricane Lee in the Atlantic, Cyclone Mocha in the North Indian Ocean, Cyclone Freddy in the southwest Indian Ocean, Cyclone Ilsa in the Australian region, and Cyclone Kevin in the South Pacific. The accumulated cyclone energy (ACE) index for the 2023, as calculated by Colorado State University (CSU) was 857.4 units overall.

References

  1. Chris Landsea. "Climate Variability table — Tropical Cyclones". Atlantic Oceanographic and Meteorological Laboratory, National Oceanic and Atmospheric Administration . Retrieved October 19, 2006.
  2. RA IV Hurricane Committee (May 9, 2023). Hurricane Operational Plan for North America, Central America and the Caribbean 2023 (PDF) (Report). World Meteorological Organization. Retrieved July 29, 2023.
  3. WMO/ESCP Typhoon Committee (March 13, 2015). Typhoon Committee Operational Manual Meteorological Component 2015 (PDF) (Report No. TCP-23). World Meteorological Organization. pp. 40–41. Retrieved March 28, 2015.
  4. RA I Tropical Cyclone Committee (2023). Tropical Cyclone Operational Plan for the South-West Indian Ocean (PDF) (Report). World Meteorological Organization.
  5. 1 2 3 RA V Tropical Cyclone Committee (2023). Tropical Cyclone Operational Plan for the South-East Indian Ocean and the Southern Pacific Ocean 2023 (PDF) (Report). World Meteorological Organization. Retrieved October 23, 2023.
  6. 1 2 3 Atlantic Oceanographic and Meteorological Laboratory, Hurricane Research Division. "Frequently Asked Questions: What are the average, most, and least tropical cyclones occurring in each basin?". NOAA . Retrieved November 30, 2006.
  7. Climate Prediction Center (August 8, 2006). "Background Information: The North Atlantic Hurricane Season". National Oceanic and Atmospheric Administration . Retrieved March 14, 2007.
  8. National Hurricane Center. "Tropical Cyclone Climatology". National Oceanic and Atmospheric Administration . Retrieved November 5, 2021.
  9. Blake, Eric S. (November 14, 2006). "Tropical Cyclone Report: Hurricane Gordon: 10–20 September 2006" (PDF). National Hurricane Center . Retrieved November 29, 2006.
  10. Franklin, James L. (February 22, 2006). "Tropical Cyclone Report: Hurricane Vince: 8–11 October 2005" (PDF). National Hurricane Center . Retrieved November 29, 2006.
  11. Vaquero, J.M.; García-Herrera, R.; Wheeler, D.; Chenoweth, M.; Mock, C.J. (February 2008). "A Historical Analog of 2005 Hurricane Vince". Bulletin of the American Meteorological Society . American Meteorological Society. 89 (2): 191–201. Bibcode:2008BAMS...89..191V. doi: 10.1175/BAMS-89-2-191 .
  12. 1 2 Climate Prediction Center, NOAA (May 22, 2006). "Background Information: East Pacific Hurricane Season". National Oceanic and Atmospheric Administration. Retrieved May 24, 2006.
  13. 1 2 Chenoweth, Michael and Christopher Landsea (November 2004). "The San Diego Hurricane of 2 October 1858" (PDF). American Meteorological Society . Retrieved December 1, 2006.
  14. 1 2 3 Atlantic Oceanographic and Meteorological Laboratory, Hurricane Research Division. "Frequently Asked Questions: What regions around the globe have tropical cyclones and who is responsible for forecasting there?". NOAA . Retrieved July 25, 2006.
  15. 1 2 Central Pacific Hurricane Center. "CPHC Climatology". National Oceanic and Atmospheric Administration . Retrieved March 2, 2007.
  16. Central Pacific Hurricane Center (1992). "The 1992 Central Pacific Tropical Cyclone Season" . Retrieved March 2, 2007.
  17. Leone, Diana (August 23, 2006). "Hawaiian-named storm hits Johnston Isle". Star Bulletin. Retrieved March 2, 2007.
  18. Atlantic Oceanographic and Meteorological Laboratory, Hurricane Research Division. "Frequently Asked Questions: When is hurricane season?". NOAA . Retrieved July 25, 2006.
  19. Weyman, James C. and Linda J. Anderson-Berry (December 2002). "Societal Impact of Tropical Cyclones". Fifth International Workshop on Tropical Cyclones. Atlantic Oceanographic and Meteorological Laboratory . Retrieved April 26, 2006.
  20. Shoemaker, Daniel N. (1991). "Characteristics of Tropical Cyclones Affecting the Philippine Islands" (PDF). Joint Typhoon Warning Center. Archived from the original (PDF) on February 5, 2012. Retrieved November 29, 2006.
  21. Why Typhoon Haiyan Caused So Much Damage (Report). NPR. November 11, 2013. Retrieved November 25, 2017.
  22. Joint Typhoon Warning Center (2004). "1.2: North Indian Tropical Cyclones". 2003 Annual Tropical Cyclone Report. Archived from the original on June 7, 2011. Retrieved November 29, 2006.
  23. Nieuwolt, Simon; Tropical climatology: an introduction to the climates of the low latitudes, p. 82 ISBN   0471994065
  24. "Medicanes: cataloguing criteria and exploration of meteorological environments Archived March 29, 2019, at the Wayback Machine ". www.tethys.cat.
  25. Emanuel, K. (2005). "Genesis and maintenance of "Mediterranean hurricanes"" (PDF). Advances in Geosciences. 2: 217–220. Bibcode:2005AdG.....2..217E. doi: 10.5194/adgeo-2-217-2005 .
  26. Microsoft Word – EGS2000-Plinius-II-Meneguzzo.doc Archived May 25, 2003, at the Wayback Machine
  27. Erik A. Rasmussen and John Turner (2003). Polar lows: mesoscale weather systems in the polar regions. Cambridge University Press. pp. 214–219. ISBN   978-0-521-62430-5 . Retrieved January 27, 2011.
  28. Schwartz (November 7, 2011). "TXMM21 KNES 071819". Satellite Services Division. National Oceanic and Atmospheric Administration. Archived from the original on November 12, 2011. Retrieved November 7, 2011.
  29. "DR. JACK BEVEN'S Images of the Mediterranean 'Hurricane' (1995) Archived June 5, 2011, at the Wayback Machine ". www.mindspring.com.
  30. World Meteorological Organization. "Tropical Cyclone RSMC / South-West Indian Ocean" ( .docx icon.svg DOC ). Archived from the original on September 8, 2006. Retrieved November 29, 2006.
  31. 1 2 G. Kingston (August 1986). "The Australian Tropical Cyclone Season" (PDF). Australian Meteorology Magazine. 34: 103. Retrieved April 29, 2013.
  32. "Tropical Cyclones in Western Australia – Climatology". Bureau of Meteorology . Retrieved August 8, 2006.
  33. "BoM — Severe Weather Event". Bureau of Meteorology . Retrieved October 19, 2008.
  34. "Tropical Cyclone Trends". Bureau of Meteorology. Archived from the original on September 23, 2012. Retrieved October 19, 2008.
  35. "BoM — Cyclone Vance produces highest recorded wind speed in Australia". Bureau of Meteorology . Retrieved October 19, 2008.