Demographics of Dominica

Last updated

This is a demography of the population of Dominica including population density, ethnicity, religious affiliations and other aspects of the population.

Contents

Census population and average annual growth rate
YearPop.±% p.a.
1871 27,178    
1881 28,211+0.37%
1891 26,841−0.50%
1901 28,894+0.74%
1911 33,863+1.60%
1921 37,059+0.91%
1946 47,624+1.01%
1960 59,916+1.65%
1970 69,549+1.50%
1981 73,795+0.54%
1991 71,183−0.36%
2001 71,242+0.01%
2011 71,293+0.01%
2021 [1] [2] 72,412+0.16%
Source: [3]

Population

According to the preliminary 2011 census results Dominica has a population of 71,293. [3] The population growth rate is very low, due primarily to emigration to more prosperous Caribbean Islands, the United Kingdom, the United States, Canada, and Australia. The estimated mid-year population of 2021 is 72,412 (the 2022 revision of the World Population Prospects [1] [2] ).

Population by parishes

NamePopulationPercentage of national populationTotal area (km²)Population density
Saint Andrew 10,46114.77%178.2759
Saint David 6,7899.58%131.652
Saint George 20,21128.54%56.1360
Saint John 5,8978.33%59100
Saint Joseph 5,7658.14%120.148
Saint Luke 1,5762.22%7.77203
Saint Mark 1,8912.67%9.9191
Saint Patrick 8,38311.84%84.499
Saint Paul 8,39711.86%67.4125
Saint Peter 1,4522.05%27.752
Flag of Dominica.svg  Dominica 70,822100%742.24105

Vital statistics

Average population (x 1000)Live birthsDeathsNatural changeCrude birth rate (per 1000)Crude death rate (per 1000)Natural change (per 1000)Total fertility rateInfant mortality rate
1950511 84894890036.218.617.6
1951521 9658741 09138.016.921.1
1952522 0911 10898340.021.218.8
1953532 0807791 30139.314.724.6
1954542 3457591 58643.714.129.5
1955552 5438701 67346.615.930.7
1956562 4169271 48943.516.726.8
1957572 5578701 68745.215.429.8
1958582 7249291 79547.116.131.1
1959592 7708261 94447.014.033.0
1960602 8129221 89046.915.431.5
1961612 6557991 85643.513.130.4
1962622 5666581 90841.410.630.8
1963632 4938351 65839.613.326.4
1964642 7036062 09742.39.532.8
1965652 8205842 23643.49.034.4
1966662 6395562 08339.88.431.4
1967682 9345162 41843.37.635.7
1968692 6866262 06038.99.129.8
1969702 6947441 95038.410.627.8
1970712 5035831 92035.28.227.0
1971722 6776642 01337.49.328.1
1972722 5915432 04836.17.628.5
1973722 2985051 79332.07.025.0
1974722 0625111 55128.77.121.6
1975721 7834831 30024.76.718.0
1976731 7585321 22624.27.316.9
1977731 7455211 22423.87.116.7
1978741 7354171 31823.45.617.8
1979751 5213041 21720.34.116.2
1980751 8193871 43224.25.119.0
1981751 6613381 32322.04.517.6
1982751 7534121 34123.35.517.8
1983751 8643491 51524.94.720.3
1984741 7164321 28423.15.817.3
1985741 7034661 23723.16.316.8
1986731 7214881 23323.66.716.9
1987721 6214551 16622.46.316.1
1988721 7314241 30724.15.918.2
1989711 6574971 16023.37.016.3
1990711 6045121 09222.67.215.4
1991711 7125181 19424.27.316.9
1992711 8365661 27025.98.017.9
1993711 7575581 19924.77.816.8
1994711 6055301 07522.57.415.1
1995711 50158491721.08.212.8
1996711 42658384320.08.211.8
1997711 34051382718.97.311.7
1998701 23659564117.68.59.1
1999701 29163166018.59.09.4
2000701 19950369617.27.210.01.75
2001701 21351070317.47.310.11.77
2002701 08159448715.58.57.01.74
2003701 05655749915.18.07.11.69
2004701 06655750915.27.97.21.67
200570.6331 00948952014.66.97.71.6420.8
200670.7511 03553849712.87.65.21.6512.6
200770.70790456733713.68.05.61.5719.9
200870.74596454541913.47.75.71.6110.4
200970.74894355938413.47.95.51.5822.3
201070.71293357935413.28.25.01.5613.9
201169.23494459235213.38.44.91.5529.7
201269.72495160334813.48.54.91.5616.8
201369.59293163030113.18.84.31.5322.6
201471.28185859026812.08.23.81.4619.8
201571.08986166419712.19.32.8
201671.37979668611011.29.61.6
201767.408647686-399.69.6-0.0
201869.573

[4] [5]

Structure of the population

Population Estimates by Sex and Age Group (31.XII.2006): [6]
Age GroupMaleFemaleTotal%
Total36 63834 94271 180100
0-43 2503 0676 3178.87
5-93 9513 6037 55410.61
10-143 5583 5477 1059.98
15-193 4523 3666 8189.58
20-242 4382 1404 5786.43
25-292 6012 5205 1217.19
30-342 8862 7775 6637.96
35-392 8412 4555 2967.44
40-442 4172 0594 4766.29
45-491 9471 6143 5615.00
50-541 4671 3532 8203.96
55-591 2091 1822 3913.36
60-641 0221 2332 2553.17
65-691 0911 2332 3243.26
70-748719731 8442.59
75-795967361 3321.87
80-843545479011.27
85+2885378251.16
Age groupMaleFemaleTotalPercent
0-1410 75910 21720 97629.47
15-6422 27920 69942 97860.38
65+3 2004 0267 22610.15
Population by Sex and Age Group (Census 14.V.2011): [6]
Age GroupMaleFemaleTotal%
Total34 97333 94068 913100
0–43 2403 1406 3809.26
5–92 6012 4955 0967.39
10–142 9462 8765 8228.45
15–193 2373 0606 2979.14
20–242 6912 5675 2587.63
25–292 3892 4724 8617.05
30–342 1181 9114 0295.85
35–392 2712 2364 5076.54
40–442 5442 4094 9537.19
45–492 3372 1354 4726.49
50–542 1621 7843 9465.73
55–591 6821 4113 0934.49
60–641 2811 2122 4933.62
65-691 0541 1052 1593.13
70-748849831 8672.71
75-797248631 5872.30
80-844676351 1021.60
85-892123875990.87
90-941011732740.40
95+32861180.17
Age groupMaleFemaleTotalPercent
0–148 7878 51117 29825.10
15–6422 71221 19743 90963.72
65+3 4744 2327 70611.18

Ethnic groups

The vast majority of Dominicans are of African descent (75% at the 2014 census). [7] There is a significant mixed population (19%) at the 2014 census due to intermarriage, along with a small European origin minority (0.8%; descendants of French, British, and Irish colonists), East Indians (0.1%) groups, and there are small numbers of Lebanese/Syrians (0.1%) and Asians.

Amerindians

Dominica is the only Eastern Caribbean island that still has a population of pre-Columbian native Caribs (also known as Kalinago), who were exterminated, driven from neighbouring islands, or mixed with Africans and/or Europeans. According to the 2001 census there are only 2,001 Caribs remaining (2.9% of the total population). A considerable growth occurred since the 1991 census when 1,634 Caribs were counted (2.4% of the total population). The Caribs live in eight villages on the east coast of Dominica. This special Carib Territory was granted by the British Crown in 1903. [8] The present number of Kalinago is estimated at 4% more than 3,000.

Other demographic statistics

Demographic statistics according to the CIA World Factbook, unless otherwise indicated. [9]

Nationality
noun: Dominican(s)
adjective: Dominican
Population
74,027 (July 2018 est.)
Ethnic groups
African descent 86.6%, mixed 9.1%, indigenous 2.9%, other 1.3%, unspecified 0.2% (2001 est.)
People - note: 3,000-3,500 Kalinago (Carib) still living on Dominica are the only pre-Columbian population remaining in the Caribbean; only 70-100 may be "pure" Kalinago because of years of integration into the broader population
Age structure
Population pyramid of Dominica in 2016 Population pyramid of Dominica 2016.png
Population pyramid of Dominica in 2016
0-14 years: 21.62% (male 8,187 /female 7,815)
15-24 years: 14.37% (male 5,473 /female 5,167)
25-54 years: 42.59% (male 15,985 /female 15,541)
55-64 years: 9.99% (male 3,927 /female 3,470)
65 years and over: 11.43% (male 3,814 /female 4,648) (2018 est.)
Median age
total: 34 years. Country comparison to the world: 88th
male: 33.5 years
female: 34.5 years (2018 est.)
Birth rate
15 births/1,000 population (2018 est.) Country comparison to the world: 125th
Death rate
7.9 deaths/1,000 population (2018 est.) Country comparison to the world: 92nd
Total fertility rate
2.03 children born/woman (2018 est.) Country comparison to the world: 114th
Net migration rate
-5.4 migrant(s)/1,000 population (2018 est.) Country comparison to the world: 196th
Population growth rate
0.17% (2018 est.) Country comparison to the world: 182nd
Languages
English (official), French patois
Religions
Roman Catholic 61.4%, Protestant 28.6% (includes Evangelical 6.7%, Seventh Day Adventist 6.1%, Pentecostal 5.6%, Baptist 4.1%, Methodist 3.7%, Church of God 1.2%, other 1.2%), Rastafarian 1.3%, Jehovah's Witness 1.2%, other 0.3%, none 6.1%, unspecified 1.1% (2001 est.)
Life expectancy at birth
total population: 77.4 years
male: 74.4 years
female: 80.5 years (2018 est.)
Urbanization
urban population: 70.5% of total population (2018)
rate of urbanization: 0.94% annual rate of change (2015-20 est.)
Obesity - adult prevalence rate
27.9% (2016) Country comparison to the world: 33rd

Languages

English is the official language and universally understood; however, because of historic French domination, Antillean Creole, a French-lexified creole language, is also widely spoken.

Religion

According to the 2001 census, 91.2% percent of the population of Dominica is considered Christian, 1.6% has a non-Christian religion and 6.1% has no religion or did not state a religion (1.1%). [7]

Roughly 58% of Christians are Roman Catholics, a reflection of early French influence on the island, and one third are Protestant. [10] The Evangelicals constitute the largest Protestant group, with 6.7% of the population. Seventh-day Adventists are the second largest group (6.1%). The next largest group are Pentecostals (5.6% of the population), followed by Baptists (4.1%). Other Christians include Methodists (3.7%), Church of God (1.2%), Jehovah's Witnesses (1.2%), Anglicanism (0.6%) and Brethren Christian (0.3%). During the past decades the number of Roman Catholics and Anglicans has decreased, while the number of other Protestants has increased, especially Evangelicals, Seventh-day Adventists, Pentecostals (5.6% of the population) and Baptists). [7]

The number of non-Christians is small. These religious groups include the Rastafarian Movement (1.3% of the population), Hinduism (0.1%) and Muslims (0.2%).

Related Research Articles

<span class="mw-page-title-main">Demographics of Antigua and Barbuda</span> National demographics

This article is a demography of the population of Antigua and Barbuda including population density, ethnicity, religious affiliations and other aspects of the population.

<span class="mw-page-title-main">Demographics of Botswana</span> Demographics of country

This article is about the demographic features of the population of Botswana, including population density, ethnicity, education level, health of the populace, economic status, religious affiliations and other aspects of the population.

<span class="mw-page-title-main">Demographics of Burundi</span>

This article is about the demographic features of the population of Burundi, including population density, ethnicity, education level, health of the populace, economic status, religious affiliations and other aspects of the population.

<span class="mw-page-title-main">Demographics of Cape Verde</span>

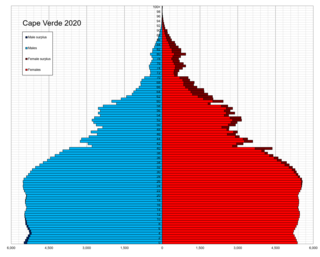
This article is about the demographic features of the population of Cape Verde, including population density, ethnicity, education level, health of the populace, economic status, religious affiliations and other aspects of the population.

<span class="mw-page-title-main">Demographics of Ivory Coast</span>

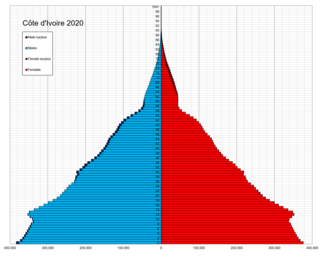
This article is about the demographic features of the population of Ivory Coast, including population density, ethnicity, education level, health of the populace, economic status, religious affiliations and other aspects of the population.

<span class="mw-page-title-main">Demographics of the Dominican Republic</span>

This is a demography of the population of the Dominican Republic including population density, ethnicity, education level, health of the populace, economic status, religious affiliations and other aspects of the population.

<span class="mw-page-title-main">Demographics of Grenada</span> National demographics

This article is a demography of the population of Grenada including population density, ethnicity, education level, health of the populace, economic status, religious affiliations and other aspects of the population.

<span class="mw-page-title-main">Demographics of Jamaica</span>

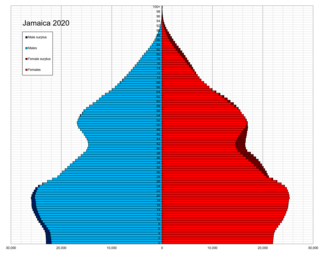
Jamaica is an island country in the Caribbean. The country had a population of 2,818,596 in 2022, the fourth largest in the region.

<span class="mw-page-title-main">Demographics of Mali</span>

This article is about the demographic features of the population of Mali, including population density, ethnicity, education level, health of the populace, economic status, religious affiliations and other aspects of the population.

<span class="mw-page-title-main">Demographics of Niger</span>

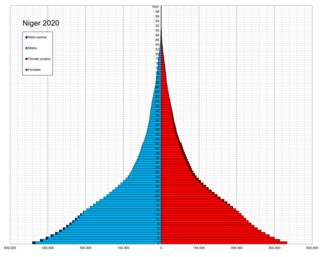
This article is about the demographic features of Nigeriens, the people of Niger, including population density, ethnicity, education level, health of the populace, economic status, religious affiliations and other aspects of the population.

<span class="mw-page-title-main">Demographics of Rwanda</span>

This article is about the demographic features of the population of Rwanda, including population density, ethnicity, education higher level, health of the populace, economic status, religious affiliations and other aspects of the population. Rwanda's population density, even after the 1994 genocide, is among the highest in Sub-Saharan Africa at 500 inhabitants per square kilometre (1,300/sq mi). This country has few villages, and nearly every family lives in a self-contained compound on a hillside. The urban concentrations are grouped around administrative centers.

<span class="mw-page-title-main">Demographics of Saint Vincent and the Grenadines</span> Demographics of country

This is a demography of the population of Saint Vincent and the Grenadines including population density, ethnicity, religious affiliations and other aspects of the population.

<span class="mw-page-title-main">Demographics of Seychelles</span>

This article is about the demographic features of the population of Seychelles, including population density, ethnicity, education level, health of the populace, economic status, religious affiliations and other aspects of the population.

<span class="mw-page-title-main">Demographics of Eswatini</span>

This article is about the demographic features of the population of Eswatini, including population density, ethnicity, education level, health of the populace, economic status, religious affiliations and other aspects of the population.

<span class="mw-page-title-main">Demographics of Madagascar</span>

This article is about the demographic features of the population of Madagascar, including population density, ethnicity, education level, health of the populace, economic status, religious affiliations and other aspects of the population.

<span class="mw-page-title-main">Demographics of Uganda</span> Aspect of human geography in Uganda

This article is about the demographic features of the population of Uganda, including population density, ethnicity, education level, health of the populace, economic status, religious affiliations and other aspects of the population.

<span class="mw-page-title-main">Demographics of the Bahamas</span>

This is a demography of the population of The Bahamas including population density, ethnicity, education level, health of the populace, economic status, religious affiliations and other aspects of the population.

<span class="mw-page-title-main">Demographics of Barbados</span> Demographics of country

This is a demography of Barbados including population density, ethnicity, education level, health of the populace, economic status, religious affiliations and other aspects of the population.

<span class="mw-page-title-main">Demographics of Belize</span> Demographics of country

This article is a demography of the population of Belize including population density, ethnicity, education level, health of the populace, economic status, religious affiliations and other aspects of the population.

<span class="mw-page-title-main">Demographics of Cuba</span>

The demographic characteristics of Cuba are known through census which have been conducted and analyzed by different bureaus since 1774. The National Office of Statistics of Cuba (ONE) since 1953. The most recent census was conducted in September 2012. The population of Cuba at the 2012 census was 11.2 million. The population density is 100.7 inhabitants per square kilometer, and the overall life expectancy in Cuba is 78.0 years. The population has always increased from one census to the next, with the exception of the 2012 census, when the count decreased by 10,000. Since 1740, Cuba's birth rate has surpassed its death rate; the natural growth rate of the country is positive. Cuba is in the fourth stage of demographic transition. In terms of age structure, the population is dominated (71.1%) by the 15- to 64-year-old segment. The median age of the population is 41.8, making it the oldest in the Americas, and the gender ratio of the total population is 0.99 males per female.

References

  1. 1 2 "World Population Prospects 2022". population.un.org. United Nations Department of Economic and Social Affairs, Population Division. Retrieved July 17, 2022.
  2. 1 2 "World Population Prospects 2022: Demographic indicators by region, subregion and country, annually for 1950-2100" (XSLX). population.un.org ("Total Population, as of 1 July (thousands)"). United Nations Department of Economic and Social Affairs, Population Division. Retrieved July 17, 2022.
  3. 1 2 "2011 POPULATION AND HOUSING CENSUS" (PDF). Dominica.gov.dm. Archived from the original (PDF) on 8 June 2019. Retrieved 29 August 2017.
  4. "United Nations. Demographic Yearbooks". Unstats.un.org. Retrieved 29 August 2017.
  5. "DEMOGRAPHIC PROFILE: DOMINICA" (PDF). Caricomstats.org. Archived (PDF) from the original on 2013-12-30. Retrieved 29 August 2017.
  6. 1 2 "UNSD — Demographic and Social Statistics". unstats.un.org. Retrieved 2023-05-10.
  7. 1 2 3 "DOMINICA NATIONAL CENSUS REPORT 2000 ROUND OF POPULATION AND HOUSING CENSUS SUB-PROJECT" (PDF). Caricomstats.org. Archived from the original (PDF) on 5 February 2018. Retrieved 29 August 2017.
  8. "The Carib Indians". Avirtualdominica.com. Retrieved 2010-06-27.
  9. PD-icon.svg This article incorporates text from this source, which is in the public domain : "World Factbook CENTRAL AMERICA : DOMINICA", The World Factbook , July 12, 2018
  10. "PEW Research Center: Christian Population as Percentages of Total Population by Country 2010". 19 December 2011. Retrieved 13 October 2015.