Demographics of Jamaica | |
---|---|
Population | 2,818,596 (2022) |
Growth rate | 0.08% (2022 est.) |
Birth rate | 12.0 births/1,000 population (2021 est.) |
Death rate | 8.8 deaths/1,000 population (2021 est.) |
Life expectancy | 75.75 years |
• male | 73.98 years |
• female | 77.6 years |
Fertility rate | 1.40 children |
Infant mortality rate | 11.17 deaths/1,000 live births |
Net migration rate | −7.7 migrant(s)/1,000 population (2022 est.) |
Nationality | |
Nationality | Jamaican |
Major ethnic | Afro-Jamaicans (76.3%) (2023) |
Minor ethnic | Afro-European (15.1%), East Indian and Afro-East Indian (3.4%), Caucasian (3.2%), Chinese (1.2%), Other (0.8%) |
Language | |
Official | English |
Spoken | English, Jamaican Patois, Mandarin, Hakka, Cantonese |
Year | Pop. | ±% |
---|---|---|
1844 | 377,433 | — |
1861 | 441,264 | +16.9% |
1871 | 506,154 | +14.7% |
1881 | 580,804 | +14.7% |
1891 | 639,491 | +10.1% |
1911 | 831,383 | +30.0% |
1921 | 858,118 | +3.2% |
1943 | 1,237,063 | +44.2% |
1960 | 1,609,814 | +30.1% |
1970 | 1,848,512 | +14.8% |
1982 | 2,190,357 | +18.5% |
1991 | 2,380,666 | +8.7% |
2001 | 2,607,632 | +9.5% |
2011 | 2,697,983 | +3.5% |
Source: [1] |
Jamaica is an island country in the Caribbean. The country had a population of 2,825,352 in 2023, the fourth largest in the region.
Jamaica's annual population growth rate stood at 0.08% in 2022. As of 2023, Jamaicans of African descent represent 76.3% of the population, followed by 15.1% Afro-European, 3.4% East Indian and Afro-East Indian, 3.2% Caucasian, 1.2% Chinese and 0.8% other. [2] 68.9% of Jamaicans were Christians in 2011, predominantly Protestant.
According to the 2022 revision of the World Population Prospects [3] [4] the total population was 2,827,695 in 2021, compared to only 1,403,000 in 1950. The proportion of children below the age of 15 in 2010 was 29%, 63.1% was between 15 and 65 years of age, while 7.8% was 65 years or older.
Graphs are unavailable due to technical issues. There is more info on Phabricator and on MediaWiki.org. |
Total population (x 1000) | Proportion aged 0–14 (%) | Proportion aged 15–64 (%) | Proportion aged 65+ (%) | |
---|---|---|---|---|
1950 | 1 403 | 36.0 | 60.1 | 3.9 |
1955 | 1 542 | 37.1 | 58.8 | 4.1 |
1960 | 1 629 | 41.8 | 53.9 | 4.3 |
1965 | 1 760 | 43.5 | 51.1 | 5.4 |
1970 | 1 869 | 47.0 | 47.4 | 5.6 |
1975 | 2 012 | 45.3 | 48.9 | 5.8 |
1980 | 2 132 | 40.3 | 53.0 | 6.8 |
1985 | 2 297 | 37.3 | 55.7 | 7.1 |
1990 | 2 365 | 35.1 | 57.5 | 7.4 |
1995 | 2 462 | 33.8 | 58.7 | 7.5 |
2000 | 2 582 | 32.5 | 59.6 | 7.9 |
2005 | 2 682 | 30.4 | 61.5 | 8.1 |
2010 | 2 741 | 27.1 | 64.5 | 8.4 |
2015 | 2 793 | 23.6 | 67.3 | 9.1 |
2019 [6] | 2 734 | 20.8 | 69.5 | 9.7 |
Age Group | Male | Female | Total | % |
---|---|---|---|---|
Total | 1 334 533 | 1 363 450 | 2 697 983 | 100 |
0–4 | 106 107 | 103 764 | 209 871 | 7.78 |
5–9 | 114 792 | 111 586 | 226 378 | 8.39 |
10–14 | 136 183 | 130 403 | 266 586 | 9.88 |
15–19 | 139 777 | 134 881 | 274 658 | 10.18 |
20–24 | 125 243 | 125 468 | 250 711 | 9.29 |
25–29 | 109 919 | 116 201 | 226 120 | 8.38 |
30–34 | 87 810 | 97 685 | 185 495 | 6.88 |
35–39 | 86 647 | 97 109 | 183 756 | 6.81 |
40–44 | 85 656 | 88 268 | 173 924 | 6.45 |
45–49 | 79 201 | 76 188 | 155 389 | 5.76 |
50–54 | 67 297 | 70 598 | 137 895 | 5.11 |
55–59 | 50 717 | 50 081 | 100 798 | 3.74 |
60–64 | 44 407 | 43 650 | 88 057 | 3.26 |
65–69 | 32 543 | 32 621 | 65 164 | 2.42 |
70–74 | 24 627 | 26 649 | 51 276 | 1.90 |
75–79 | 19 847 | 22 915 | 42 762 | 1.58 |
80–84 | 13 258 | 17 480 | 30 738 | 1.14 |
85–89 | 7 267 | 11 190 | 18 457 | 0.68 |
90–94 | 2 303 | 4 618 | 6 921 | 0.26 |
95–99 | 808 | 1 695 | 2 503 | 0.09 |
100+ | 124 | 400 | 524 | 0.02 |
Age group | Male | Female | Total | Percent |
0–14 | 357 082 | 345 753 | 702 835 | 26.05 |
15–64 | 876 674 | 900 129 | 1 776 803 | 65.86 |
65+ | 100 777 | 117 568 | 218 345 | 8.09 |
Age Group | Male | Female | Total | % |
---|---|---|---|---|
Total | 1 351 515 | 1 381 024 | 2 732 539 | 100 |
0–4 | 88 769 | 85 290 | 174 059 | 6.37 |
5–9 | 97 299 | 93 948 | 191 247 | 7.00 |
10–14 | 106 720 | 104 712 | 211 432 | 7.74 |
15–19 | 118 895 | 113 888 | 232 783 | 8.52 |
20–24 | 130 614 | 127 184 | 257 798 | 9.43 |
25–29 | 126 322 | 123 540 | 249 862 | 9.14 |
30–34 | 109 010 | 112 958 | 221 968 | 8.12 |
35–39 | 95 108 | 103 970 | 199 078 | 7.29 |
40–44 | 77 021 | 89 154 | 166 175 | 6.08 |
45–49 | 78 742 | 87 344 | 166 086 | 6.08 |
50–54 | 75 767 | 77 096 | 152 863 | 5.59 |
55–59 | 69 089 | 67 139 | 136 228 | 4.99 |
60–64 | 54 822 | 56 388 | 111 210 | 4.07 |
65-69 | 41 595 | 41 171 | 82 766 | 3.03 |
70-74 | 32 319 | 33 155 | 65 474 | 2.40 |
75-79 | 21 380 | 23 690 | 45 070 | 1.65 |
80+ | 28 043 | 40 397 | 68 440 | 2.50 |
Age group | Male | Female | Total | Percent |
0–14 | 292 788 | 283 950 | 576 738 | 21.11 |
15–64 | 935 390 | 958 661 | 1 894 051 | 69.31 |
65+ | 123 337 | 138 413 | 261 750 | 9.58 |
Average population | Live births | Deaths | Natural change | Crude birth rate (per 1000) | Crude death rate (per 1000) | Natural change (per 1000) | TFR | |
---|---|---|---|---|---|---|---|---|
1900 | 750,000 | 26,800 | 16,200 | 10,600 | 35.7 | 21.6 | 14.1 | |
1901 | 756,000 | 32,100 | 17,200 | 14,900 | 42.5 | 22.8 | 19.7 | |
1902 | 760,000 | 29,900 | 15,000 | 14,900 | 39.3 | 19.8 | 19.5 | |
1903 | 770,000 | 30,900 | 19,100 | 11,800 | 40.1 | 24.8 | 15.3 | |
1904 | 780,000 | 28,500 | 19,400 | 9,100 | 36.5 | 24.9 | 11.6 | |
1905 | 790,000 | 31,100 | 17,500 | 13,600 | 39.4 | 22.2 | 17.2 | |
1906 | 790,000 | 30,700 | 21,200 | 9,500 | 38.9 | 26.8 | 12.1 | |
1907 | 800,000 | 28,800 | 23,400 | 5,400 | 36.0 | 29.2 | 6.8 | |
1908 | 810,000 | 31,300 | 18,700 | 12,600 | 38.7 | 23.1 | 15.6 | |
1909 | 820,000 | 32,300 | 18,600 | 13,700 | 39.4 | 22.7 | 16.7 | |
1910 | 820,000 | 31,600 | 18,900 | 12,700 | 38.5 | 23.1 | 15.4 | |
1911 | 831,000 | 32,500 | 18,500 | 14,000 | 39.1 | 22.3 | 16.8 | |
1912 | 830,000 | 32,500 | 21,100 | 11,400 | 39.2 | 25.4 | 13.8 | |
1913 | 840,000 | 30,200 | 18,600 | 11,600 | 36.0 | 22.1 | 13.9 | |
1914 | 840,000 | 33,400 | 18,400 | 15,000 | 39.8 | 21.9 | 17.9 | |
1915 | 840,000 | 29,800 | 18,600 | 11,200 | 35.5 | 22.1 | 13.4 | |
1916 | 840,000 | 28,700 | 19,400 | 9,300 | 34.2 | 23.1 | 11.1 | |
1917 | 850,000 | 29,900 | 23,600 | 6,300 | 35.2 | 27.8 | 7.4 | |
1918 | 850,000 | 30,100 | 29,100 | 1,000 | 35.4 | 34.2 | 1.2 | |
1919 | 850,000 | 29,700 | 19,500 | 10,200 | 34.9 | 22.9 | 12.0 | |
1920 | 860,000 | 36,200 | 22,500 | 13,700 | 42.1 | 26.2 | 15.9 | |
1921 | 858,000 | 29,900 | 24,300 | 5,600 | 34.9 | 28.3 | 6.6 | |
1922 | 870,000 | 32,500 | 20,000 | 12,500 | 37.4 | 23.0 | 14.4 | |
1923 | 890,000 | 34,400 | 20,500 | 13,900 | 38.7 | 23.0 | 15.7 | |
1924 | 910,000 | 33,700 | 19,900 | 13,800 | 37.0 | 21.9 | 15.1 | |
1925 | 930,000 | 32,500 | 20,100 | 12,400 | 34.9 | 21.6 | 13.3 | |
1926 | 950,000 | 36,500 | 19,500 | 17,000 | 38.4 | 20.5 | 17.9 | |
1927 | 960,000 | 33,300 | 20,300 | 13,000 | 34.7 | 21.1 | 13.6 | |
1928 | 980,000 | 35,100 | 19,300 | 15,800 | 35.8 | 19.7 | 16.1 | |
1929 | 1,000,000 | 34,200 | 18,400 | 15,800 | 34.2 | 18.4 | 15.8 | |
1930 | 1,020,000 | 38,300 | 17,600 | 20,700 | 37.5 | 17.3 | 20.2 | |
1931 | 1,030,000 | 36,400 | 19,500 | 16,900 | 35.3 | 18.9 | 16.4 | |
1932 | 1,047,000 | 34,200 | 18,200 | 16,000 | 32.7 | 17.4 | 15.3 | |
1933 | 1,067,000 | 35,600 | 21,000 | 14,600 | 33.4 | 19.7 | 13.7 | |
1934 | 1,081,000 | 34,247 | 18,731 | 15,516 | 31.7 | 17.3 | 14.4 | |
1935 | 1,096,000 | 37,379 | 19,706 | 17,673 | 34.1 | 18.0 | 16.1 | |
1936 | 1,111,000 | 36,561 | 19,629 | 16,932 | 32.9 | 17.7 | 15.2 | |
1937 | 1,123,000 | 35,352 | 17,481 | 17,871 | 31.5 | 15.6 | 15.9 | |
1938 | 1,142,000 | 37,970 | 19,124 | 18,846 | 33.3 | 16.8 | 16.5 | |
1939 | 1,162,000 | 37,474 | 17,536 | 19,938 | 32.3 | 15.1 | 17.2 | |
1940 | 1,183,000 | 36,462 | 18,243 | 18,219 | 30.8 | 15.4 | 15.4 | |
1941 | 1,205,000 | 37,829 | 17,317 | 20,512 | 31.4 | 14.4 | 17.0 | |
1942 | 1,227,000 | 40,165 | 17,545 | 22,620 | 32.7 | 14.3 | 18.4 | |
1943 | 1,248,000 | 39,371 | 17,558 | 21,813 | 31.5 | 14.1 | 17.4 | |
1944 | 1,260,000 | 41,772 | 18,976 | 22,796 | 33.2 | 15.1 | 18.1 | |
1945 | 1,266,000 | 37,954 | 18,874 | 19,080 | 30.0 | 14.9 | 15.1 | |
1946 | 1,292,000 | 39,918 | 17,272 | 22,646 | 30.9 | 13.4 | 17.5 | |
1947 | 1,321,000 | 43,267 | 18,770 | 24,497 | 32.8 | 14.2 | 18.5 | |
1948 | 1,345,000 | 41,463 | 17,869 | 23,594 | 30.8 | 13.3 | 17.5 | |
1949 | 1,365,000 | 44,377 | 16,859 | 27,518 | 32.5 | 12.4 | 20.2 | |
1950 | 1,403,000 | 46,459 | 16,677 | 29,782 | 33.1 | 11.9 | 21.2 | |
1951 | 1,437,000 | 48,561 | 17,250 | 31,311 | 34.0 | 12.1 | 21.9 | |
1952 | 1,468,000 | 48,902 | 16,695 | 32,207 | 33.6 | 11.5 | 22.1 | |
1953 | 1,496,000 | 51,131 | 15,442 | 35,689 | 34.4 | 10.4 | 24.0 | |
1954 | 1,521,000 | 53,630 | 16,302 | 37,328 | 36.5 | 11.1 | 25.4 | |
1955 | 1,542,000 | 55,767 | 15,328 | 40,439 | 37.5 | 10.3 | 27.2 | |
1956 | 1,560,000 | 58,177 | 14,670 | 43,507 | 38.5 | 9.7 | 28.8 | |
1957 | 1,576,000 | 60,445 | 14,129 | 46,316 | 39.4 | 9.2 | 30.2 | |
1958 | 1,592,000 | 63,517 | 14,813 | 48,704 | 40.6 | 9.5 | 31.1 | |
1959 | 1,609,000 | 63,874 | 16,549 | 47,325 | 39.9 | 10.3 | 29.6 | |
1960 | 1,629,000 | 68,413 | 14,321 | 54,092 | 42.5 | 8.9 | 33.6 | |
1961 | 1,652,000 | 66,128 | 14,193 | 51,935 | 40.5 | 8.7 | 31.8 | |
1962 | 1,679,000 | 64,913 | 14,167 | 50,746 | 39.1 | 8.5 | 30.6 | |
1963 | 1,707,000 | 66,189 | 15,159 | 51,030 | 39.0 | 8.9 | 30.1 | |
1964 | 1,735,000 | 68,359 | 13,267 | 55,092 | 39.3 | 7.6 | 31.7 | |
1965 | 1,760,000 | 69,768 | 14,084 | 55,684 | 39.6 | 8.0 | 31.6 | |
1966 | 1,783,000 | 71,364 | 14,288 | 57,076 | 40.0 | 8.0 | 32.0 | |
1967 | 1,804,000 | 67,438 | 13,295 | 54,143 | 37.4 | 7.4 | 30.0 | |
1968 | 1,824,000 | 65,402 | 14,557 | 50,845 | 35.9 | 8.0 | 27.9 | |
1969 | 1,845,000 | 64,668 | 14,094 | 50,574 | 35.1 | 7.6 | 27.4 | |
1970 | 1,869,000 | 64,375 | 14,352 | 50,023 | 34.4 | 7.7 | 26.8 | |
1971 | 1,896,000 | 66,277 | 14,078 | 52,199 | 34.9 | 7.4 | 27.5 | |
1972 | 1,925,000 | 66,219 | 13,970 | 52,249 | 34.3 | 7.2 | 27.1 | |
1973 | 1,955,000 | 61,857 | 14,157 | 47,700 | 31.6 | 7.2 | 24.3 | |
1974 | 1,984,000 | 61,506 | 14,374 | 47,132 | 30.9 | 7.2 | 23.7 | |
1975 | 2,012,000 | 61,462 | 14,004 | 47,458 | 30.3 | 6.9 | 23.4 | |
1976 | 2,037,000 | 60,658 | 14,671 | 45,987 | 29.6 | 7.2 | 22.4 | |
1977 | 2,059,000 | 60,423 | 14,245 | 46,178 | 29.1 | 6.9 | 22.3 | |
1978 | 2,081,000 | 58,189 | 12,148 | 46,041 | 27.9 | 5.8 | 22.1 | |
1979 | 2,105,000 | 59,126 | 13,297 | 45,829 | 28.0 | 6.3 | 21.7 | |
1980 | 2,132,000 | 58,589 | 12,706 | 45,883 | 27.5 | 6.0 | 21.5 | 3.56 |
1981 | 2,165,000 | 59,435 | 13,315 | 46,120 | 27.5 | 6.2 | 21.3 | 3.50 |
1982 | 2,200,000 | 61,477 | 12,698 | 48,779 | 27.9 | 5.8 | 22.2 | 3.40 |
1983 | 2,237,000 | 61,417 | 12,588 | 48,829 | 27.4 | 5.6 | 21.8 | 3.21 |
1984 | 2,270,000 | 57,533 | 13,405 | 44,128 | 25.2 | 5.9 | 19.4 | 2.73 |
1985 | 2,297,000 | 56,210 | 13,918 | 42,292 | 24.3 | 6.0 | 18.3 | 2.56 |
1986 | 2,317,000 | 54,067 | 13,341 | 40,726 | 23.1 | 5.7 | 17.4 | 2.40 |
1987 | 2,332,000 | 52,270 | 12,352 | 39,918 | 22.2 | 5.3 | 17.0 | 2.27 |
1988 | 2,342,000 | 53,623 | 12,167 | 41,456 | 22.7 | 5.2 | 17.6 | 2.31 |
1989 | 2,353,000 | 59,104 | 14,315 | 44,789 | 24.7 | 6.0 | 18.7 | 2.43 |
1990 | 2,365,000 | 59,606 | 12,174 | 47,432 | 25.2 | 5.1 | 20.1 | 2.45 |
1991 | 2,381,000 | 59,879 | 13,319 | 46,560 | 25.2 | 5.6 | 19.6 | 2.44 |
1992 | 2,399,000 | 56,276 | 13,225 | 43,051 | 23.5 | 5.5 | 17.9 | 2.34 |
1993 | 2,419,000 | 58,627 | 13,927 | 44,700 | 24.2 | 5.8 | 18.5 | 2.44 |
1994 | 2,440,000 | 57,404 | 13,503 | 43,901 | 23.5 | 5.5 | 18.0 | 2.38 |
1995 | 2,462,000 | 57,607 | 12,776 | 44,831 | 23.4 | 5.2 | 18.2 | 2.37 |
1996 | 2,485,000 | 57,370 | 14,854 | 42,516 | 23.1 | 6.0 | 17.1 | 2.33 |
1997 | 2,509,000 | 59,385 | 15,967 | 43,418 | 23.7 | 6.4 | 17.3 | 2.42 |
1998 | 2,534,000 | 56,937 | 16,150 | 40,787 | 22.5 | 6.4 | 16.1 | 2.29 |
1999 | 2,559,000 | 56,911 | 17,550 | 39,361 | 22.2 | 6.9 | 15.4 | 2.29 |
2000 | 2,582,000 | 54,035 | 16,400 | 37,635 | 20.9 | 6.4 | 14.6 | 2.13 |
2001 | 2,605,000 | 49,291 | 16,615 | 32,676 | 18.9 | 6.4 | 12.5 | 1.92 |
2002 | 2,620,000 | 47,464 | 16,728 | 30,736 | 18.2 | 6.4 | 11.8 | 1.84 |
2003 | 2,629,000 | 45,559 | 17,267 | 28,292 | 17.4 | 6.6 | 10.8 | 1.77 |
2004 | 2,639,000 | 44,843 | 16,332 | 28,511 | 17.0 | 6.2 | 10.8 | 1.73 |
2005 | 2,644,000 | 46,370 | 17,413 | 28,957 | 17.5 | 6.6 | 11.0 | 1.81 |
2006 | 2,653,000 | 43,243 | 18,960 | 24,283 | 16.3 | 7.2 | 9.2 | 1.70 |
2007 | 2,662,000 | 43,385 | 20,550 | 22,835 | 16.3 | 7.7 | 8.6 | 1.71 |
2008 | 2,672,000 | 43,112 | 19,966 | 23,146 | 16.1 | 7.5 | 8.7 | 1.70 |
2009 | 2,681,000 | 42,782 | 18,555 | 24,227 | 16.0 | 7.0 | 8.9 | 1.68 |
2010 | 2,691,000 | 40,508 | 21,503 | 19,005 | 15.1 | 8.0 | 7.1 | 1.57 |
2011 | 2,700,000 | 39,673 | 16,926 | 22,747 | 14.7 | 6.3 | 8.4 | 1.54 |
2012 | 2,708,000 | 39,553 | 16,998 | 22,555 | 14.5 | 6.3 | 8.3 | 1.55 |
2013 | 2,715,000 | 36,746 | 15,427 | 21,319 | 13.5 | 5.7 | 7.8 | 1.52 |
2014 | 2,721,000 | 36,996 | 18,320 | 18,676 | 13.6 | 6.7 | 6.9 | 1.51 |
2015 | 2,723,000 | 37,900 | 19,249 | 18,651 | 13.9 | 7.1 | 6.8 | 1.53 |
2016 | 2,727,000 | 36,160 | 19,761 | 16,399 | 13.3 | 7.2 | 6.1 | 1.50 |
2017 | 2,728,000 | 34,423 | 19,661 | 14,762 | 12.6 | 7.2 | 5.4 | 1.46 |
2018 | 2,731,000 | 34,209 | 19,762 | 14,447 | 12.5 | 7.2 | 5.3 | 1.42 |
2019 | 2,734,000 | 34,632 | 20,937 | 13,695 | 12.7 | 7.7 | 5.0 | |
2020 | 2,735,000 | 33,941 | 20,238 | 13,703 | 12.4 | 7.4 | 5.0 | |
2021 | 2,737,000 | 33,126 | 26,974 | 6,152 | 12.1 | 9.8 | 2.3 | |
2022 | 2,738,000 | 31,276 | 21,390 | 9,886 | 11.4 | 7.8 | 3.6 |
Period | Life expectancy in Years | Period | Life expectancy in Years |
---|---|---|---|
1950–1955 | 58.6 | 1985–1990 | 72.1 |
1955–1960 | 62.7 | 1990–1995 | 72.0 |
1960–1965 | 65.7 | 1995–2000 | 72.1 |
1965–1970 | 67.2 | 2000–2005 | 72.8 |
1970–1975 | 69.0 | 2005–2010 | 74.2 |
1975–1980 | 70.7 | 2010–2015 | 75.5 |
1980–1985 | 72.0 |
Source: UN World Population Prospects [11]
Demographic statistics below are based on the 2022 World Population Review. [12]
The following demographic statistics are from The World Factbook by the CIA, unless otherwise referenced. [13]
11.4 births/1,000 population (2022 est.) Country comparison to the world: 103rd
definition: age 15 and over has ever attended school
English, Jamaican Patois
Protestant 64.8% (includes Seventh Day Adventist 12.0%, Pentecostal 11.0%, Other Church of God 9.2%, New Testament Church of God 7.2%, Baptist 6.7%, Church of God in Jamaica 4.8%, Church of God of Prophecy 4.5%, Anglican 2.8%, United Church 2.1%, Methodist 1.6%, Revived 1.4%, Brethren 0.9%, and Moravian 0.7%), Roman Catholic 2.2%, Jehovah's Witness 1.9%, Rastafarian 1.1%, other 6.5%, none 21.3%, unspecified 2.3% (2011 est.)
Black 92.1%, mixed 6.1%, East Indian 0.8%, other 0.4%, unspecified 0.7% (2011 est.)
This article is a demography of the population of Antigua and Barbuda including population density, ethnicity, religious affiliations and other aspects of the population.
Demographic features of the population of Botswana include population density, ethnicity, education level, health of the populace, economic status, religious affiliations and other aspects.
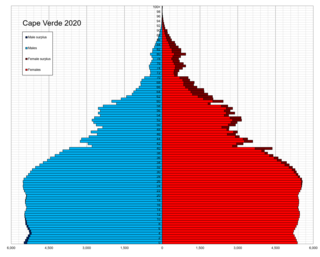
Demographic features of the population of Cape Verde include population density, ethnicity, education level, health of the populace, economic status, religious affiliations and other aspects of the population.
Demographic features of the population of the Central African Republic include population density, ethnicity, education level, health of the populace, economic status, religious affiliations and other aspects of the population.
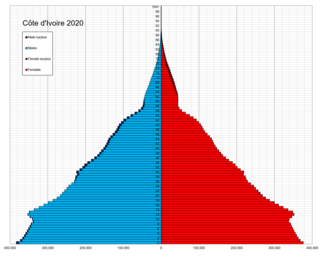
Demographic features of the population of Ivory Coast include population density, ethnicity, education level, health of the populace, economic status, religious affiliations and other aspects of the population.
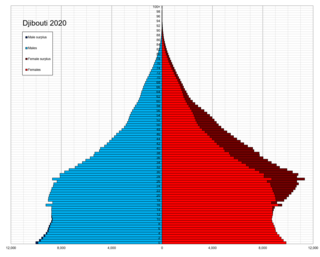
Demographic features of Djibouti include population density, ethnicity, education level, health, economic status, religious affiliations and other aspects.
This is a demography of the population of Dominica including population density, ethnicity, religious affiliations and other aspects of the population.
This is a demography of the population of the Dominican Republic including population density, ethnicity, education level, health of the populace, economic status, religious affiliations and other aspects of the population.
Demographic features of the population of Lesotho include population density, ethnicity, education level, health of the populace, economic status, religious affiliations and other aspects.
Demographic features of the population of Mali include population density, ethnicity, education level, health of the populace, economic status, religious affiliations and other aspects of the population.
Mauritian society includes people from many different ethnic groups as well as a significant population of mixed-race people who have ancestry from more than one ethnic group. A majority of the republic's residents are the descendants of people from India. Mauritius also contains substantial populations from continental Africa, China, France, and the East African island nation of Madagascar. Mauritius had a population of 1,235,260 according to the final results of the 2022 Census. The population on the island of Mauritius was 1,191,280, and that of Rodrigues island was 43,650 ; Agalega island total population of 330. Mauritius has the second highest population density in Africa. According to the 2022 census, the average age of the population was 38 years. 2022 Census indicated that: The proportion of children aged below 15 years went down from 20.7% in 2011 to 15.4% in 2022; The share of persons aged 60 years and over has risen from 12.7% in 2011 to 18.7% in 2022.
Demographic features of the population of Rwanda include population density, ethnicity, education higher level, health of the populace, economic status, religious affiliations and other aspects.
Demographic features of the population of Samoa include population density, ethnicity, education level, health of the populace, economic status, religious affiliations and other aspects of the population.
Demographic features of the population of São Tomé and Príncipe include population density, ethnicity, education level, health of the populace, economic status, religious affiliations and other aspects.
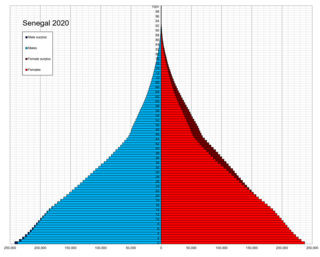
Demographic features of the population of Senegal include population density, ethnicity, education level, health of the populace, economic status, religious affiliations and other aspects of the population.
Demographic features of the population of Eswatini include population density, ethnicity, education level, health of the populace, economic status, religious affiliations and other aspects of the population.
Venezuela is a country in South America. The Venezuelan people comprise a combination of heritages, primarily Native American and European. The historically present Native American, Spanish colonists, and African slaves have all contributed to varying degrees. Later, waves of European groups migrated to Venezuela in the 20th century, influencing many aspects of Venezuelan life, including its culture, language, food, and music though small in number.
Demographic features of the population of Zimbabwe include population density, ethnicity, education level, health of the populace, economic status, religious affiliations and other aspects of the population.
This is a demography of the population of The Bahamas including population density, ethnicity, education level, health of the populace, economic status, religious affiliations and other aspects of the population.
This is a demography of Barbados including population density, ethnicity, education level, health of the populace, economic status, religious affiliations and other aspects of the population.
This article incorporates public domain material from The World Factbook. CIA.