Demographics of Ghana

Last updated

Demographics of Ghana
Ghana single age population pyramid 2020.png
Population pyramid of Ghana in 2020
Population33,107,275 (2022 est.)
Growth rate2.23% (2022 est.)
Birth rate28.55 births/1,000 population (2022 est.)
Death rate6.14 deaths/1,000 population (2022 est.)
Life expectancy69.37 years
  male67.7 years
  female71.09 years
Fertility rate3.66 children born/woman (2022 est.)
Infant mortality rate32.59 deaths/1,000 live births
Net migration rate-0.16 migrant(s)/1,000 population (2022 est.)
Age structure
0–14 years37.44%
65 and over4.44%
Sex ratio
Total0.95 male(s)/female (2022 est.)
At birth1.03 male(s)/female
Under 151.02 male(s)/female
65 and over0.72 male(s)/female
Nationality
NationalityGhanaian
Major ethnicAkan (45.7%)
Language
OfficialEnglish

Demographic features of the population of Ghana include population density, ethnicity, education level, health of the populace, religious affiliations, and other aspects.

Contents

Ghana's population is 30,832,019 (2021 census). [1]

Languages

A map of Ghana's ethno-linguistic areas. Predominant tribe in the area - (Ghana) LOC 88692692.jpg
A map of Ghana's ethno-linguistic areas.

Ghana is a multilingual country in which about 80 languages are spoken. [2] English is the official language and lingua franca. [3] [4] Of the languages indigenous to Ghana, Akan is the most widely spoken. [5]

Ghana has more than seventy ethnic groups, each with its own distinct language. [6] Languages that belong to the same ethnic group are usually mutually intelligible.

Eleven languages have the status of government-sponsored languages: four Akan ethnic languages (Akuapem Twi, Asante Twi, Fante and Nzema) and two Mole-Dagbani ethnic languages (Dagaare and Dagbanli). The rest are Ewe, Dangme, Ga, Gonja, and Kasem, Hausa. [7]

Ethnic groups

Ghana has more than seventy native ethnic groups. [6] Major native African ethnic groups in Ghana include the Akan at 45.7% of the population, the Mole-Dagbon at 18.5%, the Ewe at 13.9%, the Ga-Dangme at 7.1%, the Gurma at 6.4%, the Guan at 3.2%, the Grusi at 2.7%, Mande at 2% and others at 1.6%. [8] Some 20 thousands of Native Europeans live in Ghana. [9]

Education

Primary and junior secondary school education is tuition-free and mandatory. Since 1987, the Government of Ghana has increased its education budget by 700%. Basic education's share has grown from 45% to 60% of that total.

Students begin their six-year primary education at the age of six. They pass into a junior secondary school system for 3 years of academic training combined with technical and vocational training. Those continuing move into the three-year senior secondary school program. Entrance to one of the best Ghanaian universities is by examination following completion of senior secondary school with a pass mark.

Historical population of Ghana.png

Ghana's first post independence population census in 1961 counted about 6.7 million inhabitants. [10] Between 1965 and 1989, a constant 45 percent of Ghana total female population was of childbearing age. [10]

The crude death rate of 18 per 1,000 population in 1965 fell to 13 per 1,000 population in 1992. Life expectancy rose from a 1992 average of 42 years for men and 45 years for women to 52 and 56 years in 2002. The fertility rate averaged two children per adult female in 2013. [10]

Population by Sex and Age Group (Census 26.IX.2010): [11]

Age GroupMaleFemaleTotal%
Total12 024 84512 633 97824 658 823100
0–41 731 7871 673 6193 405 40613.81
5–91 589 6321 539 3203 128 95212.69
10–141 477 5251 438 5152 916 04011.83
15–191 311 1121 298 8772 609 98910.58
20–241 100 7271 222 7642 323 4919.42
25–29943 2131 106 8982 050 1118.31
30–34790 301888 5081 678 8096.81
35–39676 768744 6351 421 4035.76
40–44572 620613 7301 186 3504.81
45–49452 975485 123938 0983.80
50–54394 600438 498833 0983.38
55–59258 582265 113523 6952.12
60–64227 050248 799475 8491.93
65-69136 244157 627293 8711.19
70-74149 512201 818351 3301.42
75-7989 149116 804205 9530.84
80-8462 35796 727159 0840.65
85-8932 93750 13383 0700.34
90-9419 00432 07751 0810.21
95+8 75014 39323 1430.09
Age groupMaleFemaleTotalPercent
0–144 798 9444 651 4549 450 39838.32
15–646 727 9487 312 94514 040 89356.94
65+497 953669 5791 167 5324.73

Population Estimates by Sex and Age Group (01.VII.2015) (Data based on the 2010 Population Census.): [12]

Age GroupMaleFemaleTotal%
Total13 562 09314 108 08127 670 174100
0–42 020 7761 978 6343 999 41014.45
5–91 688 4521 624 4263 312 87811.97
10–141 567 0431 530 3093 097 35211.19
15–191 414 9871 410 5912 825 57810.21
20–241 251 7591 286 0402 537 7999.17
25–291 083 8771 168 6162 252 4938.14
30–34935 9471 031 2191 967 1667.11
35–39785 200880 0371 665 2376.02
40–44661 789742 5201 404 3095.08
45–49546 030599 9021 145 9324.14
50–54445 531487 737933 2683.37
55–59348 118379 884728 0022.63
60–64270 642299 974570 6162.06
65–69196 219223 282419 5011.52
70–74142 378170 878313 2561.13
75–7996 514126 573223 0870.81
80+106 831167 459274 2900.99
Age groupMaleFemaleTotalPercent
0–145 276 2715 133 36910 409 64037.62
15–647 743 8808 286 52016 030 40057.93
65+541 942688 1921 230 1344.45

Births and deaths based on UNDESA

In July 2022, the United Nations published its 2022 World Population Prospects, a biennially-updated database where key demographic indicators are estimated and projected worldwide down to the country level. They prepared the following estimates of demographic indicators in Ghana for every year from 1950 to 2021, as well as projections for future decades. [13]

Mid-year populationLive birthsDeathsNatural changeCrude birth rate (per 1000)Crude death rate (per 1000)Natural change (per 1000) Total fertility rate (TFR) Infant mortality (per 1000 live births) Life expectancy (in years)
19505 078 000  237 000  114 000  123 00046.822.624.26.59149.243.11
1951  5 220 000  250 000  116 000  135 00048.022.225.86.64145.543.65
1952  5 373 000  263 000  117 000  145 00049.021.927.16.68142.244.07
1953  5 535 000  276 000  119 000  157 00049.821.528.36.73139.044.59
1954  5 706 000  287 000  121 000  167 00050.321.129.26.75136.145.08
1955  5 887 000  298 000  122 000  176 00050.720.829.96.77133.245.50
1956  6 077 000  309 000  124 000  185 00050.920.430.56.80130.645.90
1957  6 276 000  319 000  126 000  193 00050.820.030.86.81128.346.26
1958  6 479 000  328 000  128 000  201 00050.719.731.06.82126.246.50
1959  6 690 000  337 000  129 000  207 00050.419.331.06.83124.646.87
1960  6 912 000  344 000  131 000  213 00049.819.030.86.85123.147.10
1961  7 109 000  352 000  133 000  219 00049.318.730.76.89122.047.33
1962  7 281 000  359 000  137 000  222 00049.218.730.46.95121.247.41
1963  7 458 000  367 000  140 000  226 00049.018.730.36.98120.647.58
1964  7 640 000  371 000  143 000  228 00048.418.729.76.93120.147.72
1965  7 828 000  376 000  146 000  230 00047.918.629.36.89120.047.78
1966  8 020 000  381 000  150 000  231 00047.418.628.76.88120.047.73
1967  8 216 000  389 000  153 000  236 00047.218.628.66.91120.247.68
1968  8 418 000  398 000  157 000  241 00047.218.728.56.91120.347.57
1969  8 630 000  409 000  161 000  248 00047.318.628.76.96120.347.57
1970  8 862 000  418 000  163 000  255 00047.218.428.86.95120.147.81
1971  9 109 000  428 000  166 000  261 00046.918.328.76.94119.747.80
1972  9 366 000  436 000  166 000  270 00046.517.828.86.91118.448.03
1973  9 637 000  446 000  167 000  279 00046.217.328.96.87116.748.40
1974  9 919 000  455 000  168 000  287 00045.816.929.06.83114.548.78
1975  10 210 000  464 000  168 000  296 00045.416.429.06.77112.049.25
1976  10 509 000  473 000  168 000  305 00045.015.929.06.72109.149.76
1977  10 825 000  484 000  169 000  315 00044.715.629.16.68106.650.09
1978  11 163 000  498 000  171 000  327 00044.715.329.36.61104.450.57
1979  11 516 000  514 000  175 000  339 00044.715.229.56.56102.850.93
1980  11 865 000  532 000  179 000  353 00044.815.129.76.52101.651.12
1981  12 213 000  549 000  181 000  368 00045.014.830.16.47100.851.27
1982  12 585 000  563 000  183 000  380 00044.814.630.26.38100.251.38
1983  12 984 000  582 000  187 000  395 00044.814.430.46.3198.951.62
1984  13 342 000  602 000  190 000  412 00044.914.230.86.2497.152.05
1985  13 651 000  608 000  189 000  418 00044.313.830.56.1994.952.42
1986  13 972 000  613 000  186 000  427 00043.813.330.56.1592.253.13
1987  14 311 000  618 000  184 000  434 00043.012.830.26.0989.153.82
1988  14 672 000  618 000  181 000  437 00042.012.329.75.9685.854.51
1989  15 052 000  620 000  178 000  441 00041.111.829.35.8382.755.19
1990  15 447 000  625 000  178 000  447 00040.411.528.95.7179.855.62
1991  15 843 000  629 000  178 000  451 00039.611.228.45.5977.656.01
1992  16 242 000  630 000  179 000  451 00038.711.027.75.4775.756.23
1993  16 644 000  632 000  181 000  451 00037.910.927.05.3674.356.42
1994  17 041 000  627 000  187 000  441 00036.810.925.85.1973.756.11
1995  17 439 000  632 000  186 000  445 00036.210.725.55.0772.656.57
1996  17 844 000  633 000  188 000  445 00035.410.524.94.9371.456.82
1997  18 268 000  644 000  189 000  456 00035.310.324.94.8770.257.20
1998  18 715 000  660 000  190 000  471 00035.310.125.14.8468.657.60
1999  19 177 000  680 000  191 000  489 00035.410.025.54.8466.658.03
2000  19 666 000  706 000  195 000  510 00035.99.925.94.8564.358.20
2001  20 196 000  719 000  201 000  518 00035.610.025.74.7962.158.11
2002  20 758 000  733 000  202 000  531 00035.39.725.64.7259.958.61
2003  21 330 000  745 000  203 000  542 00034.99.525.44.6358.059.11
2004  21 906 000  756 000  207 000  549 00034.59.525.14.5356.359.19
2005  22 497 000  785 000  208 000  577 00034.99.225.64.5454.959.76
2006  23 099 000  788 000  211 000  577 00034.19.125.04.4153.559.99
2007  23 708 000  795 000  214 000  581 00033.69.024.54.3152.060.22
2008  24 326 000  807 000  217 000  591 00033.28.924.34.2550.560.49
2009  24 951 000  823 000  217 000  606 00033.08.724.34.2148.860.95
2010  25 575 000  844 000  221 000  624 00033.08.624.44.2147.061.16
2011  26 206 000  864 000  221 000  643 00033.08.424.54.1945.261.65
2012  26 859 000  883 000  221 000  662 00032.98.224.64.1843.462.08
2013  27 526 000  896 000  223 000  673 00032.58.124.44.1441.762.42
2014  28 196 000  898 000  220 000  677 00031.87.824.04.0540.263.05
2015  28 871 000  916 000  225 000  691 00031.77.823.94.0538.763.18
2016  29 554 000  902 000  220 000  682 00030.57.523.13.9137.463.89
2017  30 222 000  876 000  223 000  652 00029.07.421.63.7136.264.01
2018  30 871 000  897 000  228 000  669 00029.07.421.73.7335.164.12
2019  31 522 000  901 000  225 000  676 00028.67.121.43.6834.064.74
2020  32 180 000  902 000  240 000  663 00028.07.420.63.6233.064.11
2021  32 833 000  905 000  250 000  654 00027.57.619.93.5632.163.80

Fertility and births based on Demographics Health Survey

Total Fertility Rate (TFR) (Wanted Fertility Rate) and Crude Birth Rate (CBR) Demographics Health Survey: [14]

YearCBR (Total)TFR (WFR) (Total)CBR (Urban)TFR (WFR) (Urban)CBR (Rural)TFR (WFR) (Rural)
199338.05.5 (4.2)32.93.99 (2.9)40.26.36 (4.9)
199832.74.55 (3.7)25.42.96 (2.4)36.05.41 (4.3)
200332.64.4 (3.7)26.63.1 (2.6)36.75.6 (4.6)
200733.34.628.43.436.35.5
200830.84.0 (3.5)27.13.1 (2.7)33.64.9 (4.2)
201430.64.2 (3.6)27.93.4 (3.1)33.55.2 (4.3)
201730.03.928.33.331.74.7
202227.93.9 (3.4)25.13.2 (2.8)30.94.8 (4.2)

Fertility and births (Census 2000 and 2010)

Total Fertility Rate (TFR) and Crude Birth Rate (CBR): [15]

YearCBR (Total)TFR (Total)CBR (Urban)TFR (Urban)CBR (Rural)TFR (Rural)
200031.13.9926.73.033.84.9
201025.33.2823.02.7826.93.94

Births and deaths [16]

YearPopulationLive birthsDeathsNatural increaseCrude birth rateCrude death rateRate of natural increaseTFR
201024,200,000623,700163,534460,16625.36.618.73.28

Fertility data as of 2014 (DHS Program): [17]

RegionTotal fertility ratePercentage of women aged 15–49 currently pregnantMean number of children ever born to women aged 40–49
Western 3.66.94.8
Central 4.77.85.2
Greater Accra 2.86.93.4
Volta 4.36.14.8
Eastern 4.27.94.9
Ashanti 4.25.84.8
Brong Ahafo 4.87.65.1
Northern 6.68.96.4
Upper East 4.97.95.7
Upper West 5.26.86.4

Other demographic statistics

Demographic statistics according to the World Population Review in 2022. [18]

The following demographics are from the independent Ghana Statistical Service [19] and from the CIA World Factbook [20] unless otherwise indicated.

Population

33,107,275 (2022 est.)
30,802,793 (Feb 2020 )
25,009,153 (December 2013 est. [21] [22] ) Females- 50.5% Male- 49.5%

Religions

Christian 71.3% (Pentecostal/Charismatic 31.6%, Protestant 17.4%, Catholic 10%, other 12.3%), Muslim 19.9%, traditionalist 3.2%, 2.1% Hindu, other 1.3%, none 1.1% (2021 est.)

Age structure

Population pyramid of Ghana in 2020 Ghana single age population pyramid 2020.png
Population pyramid of Ghana in 2020
0-14 years: 37.44% (male 5,524,932/female 5,460,943)
15-24 years: 18.64% (male 2,717,481/female 2,752,601)
25-54 years: 34.27% (male 4,875,985/female 5,177,959)
55-64 years: 5.21% (male 743,757/female 784,517)
65 years and over: 4.44% (male 598,387/female 703,686) (2020 est.)
0–14 years: 37.83% (male 5,344,146 /female 5,286,383)
15–24 years: 18.61% (male 2,600,390 /female 2,629,660)
25–54 years: 34.21% (male 4,663,234 /female 4,950,888)
55–64 years: 5.05% (male 690,327 /female 727,957)
65 years and over: 4.3% (male 557,155 /female 652,331) (2018 est.)

Population growth rate

2.23% (2022 est.) Country comparison to the world: 35th
2.16% (2018 est.) Country comparison to the world: 40th

Birth rate

28.55 births/1,000 population (2022 est.) Country comparison to the world: 34th
30.2 births/1,000 population (2018 est.) Country comparison to the world: 35th
16.03 births/1,000 population (2013 est.)

Death rate

6.14 deaths/1,000 population (2022 est.) Country comparison to the world: 150th
6.8 deaths/1,000 population (2018 est.) Country comparison to the world: 134th
7.53 deaths/1,000 population (2013 est.)

Total fertility rate

3.61 children born/woman (2023 est.) Country comparison to the world: 32nd
3.66 children born/woman (2022 est.) Country comparison to the world: 33rd
3.96 children born/woman (2018 est.) Country comparison to the world: 34th
Fertility rate declined from 3.99 (2000) to 3.28 (2010) with 2.78 in Urban region and 3.94 in rural region. [15]

Median age

total: 21.4 years. Country comparison to the world: 184th
male: 21 years
female: 21.9 years (2020 est.)
total: 21.2 years. Country comparison to the world: 185th
male: 20.7 years
female: 21.7 years (2018 est.)

Mother's mean age at first birth

22.3 years (2017 est.)
note: median age at first birth among women 25–29

Contraceptive prevalence rate

27.2% (2017/18)

Net migration rate

-0.16 migrant(s)/1,000 population (2022 est.) Country comparison to the world: 107th
-1.8 migrant(s)/1,000 population (2017 est.) Country comparison to the world: 154th
-1.85 migrant(s)/1,020 population (2013 est.)

Infant mortality rate

39.01 deaths/1,000 live births (2013 est.)

Dependency ratios

total dependency ratio: 73 (2015 est.)
youth dependency ratio: 67.1 (2015 est.)
elderly dependency ratio: 5.9 (2015 est.)
potential support ratio: 17.1 (2015 est.)

Urbanization

urban population: 58.6% of total population (2022)
rate of urbanization: 3.06% annual rate of change (2020–25 est.)
urban population: 56.1% of total population (2018)
rate of urbanization: 3.34% annual rate of change (2015–20 est.)

Life expectancy at birth

total population: 69.37 years. Country comparison to the world: 178th
male: 67.7 years
female: 71.09 years (2022 est.)
total population: 67.4 years (2018 est.)
male: 64.9 years (2018 est.)
female: 70 years (2018 est.)
total population: 65.46 years (2013 est.); 66 years
male: 64.48 years (2013 est.); 66 years
female: 66.48 years (2013 est.); 67 years (2013 est.)

Nationality

noun: Ghanaian
adjective: Ghanaian

Citizenship

Ghanaian people

Languages

Asante [8] 16%, Ewe [8] 13%, Fante [8] 11.6%, Dagbanli [23] 10%, Bono [8] (Brong) 4.9%, Dangme [8] 4.2%, Dagarte [8] (Dagaba) 3.9%, Likpakpaanl [8] a.k.a. Konkomba language 3.5%, Akyem [8] 3.2%, Ga [8] 3.1%, Other [8] 31.2%

Literacy

Definition: aged 15 and over can read and write

total population: 79%
male: 83.5%
female: 74.5% (2018)
total population: 76.6% (2015 est.)
male: 82% (2015 est.)
female: 71.4% (2015 est.)

School life expectancy (primary to tertiary education)

total: 12 years
male: 12 years
female: 12 years (2020)
total population: 71.5%
male: 78.3%
female: 65.3% (2010 census)

Major infectious diseases

degree of risk: very high (2020)
food or waterborne diseases: bacterial and protozoal diarrhea, hepatitis A, and typhoid fever
vectorborne diseases: malaria, dengue fever, and yellow fever
water contact diseases: schistosomiasis
animal contact diseases: rabies
respiratory diseases: meningococcal meningitis
note: since October 2021, there has been a yellow fever outbreak in Ghana with numerous cases, including some deaths, in the following regions: Savannah, Upper West, Bono, and Oti; the CDC recommends travelers going to Ghana should receive vaccination against yellow fever at least 10 days before travel and should take steps to prevent mosquito bites while there; those never vaccinated against yellow fever should avoid travel to Nigeria during the outbreak; there are no medications to treat or cure yellow fever

Unemployment, youth ages 15–24

total: 9.1%
male: 9.4%
female: 8.7% (2017 est.)

Demographic history

Historical population

Ghana's Population in Census Years
Year [24] Total recorded population
Pre-independence
1891764,613
19011,549,661
19111,503,911
19212,296,400
19313,160,386
19484,118,459
Post-independence
19606,726,815
19708,559,313
198412,296,081
200018,912,079
201024,658,823
202130,832,019

Population distribution

Population density in Western Africa Human population density in Western Africa.png
Population density in Western Africa

Population density increased steadily from 36 per square kilometer in 1970 to 52 per square kilometer in 1984. In 1990 63 persons per square kilometer was the estimate for Ghana's overall population density. These averages did not reflect variations in population distribution. For example, while the Northern Region, one of ten administrative regions, showed a density of seventeen persons per square kilometer in 1984, in the same year Greater Accra Region recorded nine times the national average of 52 per square kilometer. [25]

As was the case in the 1960 and 1970 figures, the greatest concentration of population in 1984 was to the south of the Kwahu Plateau. The highest concentration of habitation continued to be within the Accra-Kumasi-Takoradi triangle, largely because of the economic productivity of the region. All of Ghana's mining centres, timber-producing deciduous forests, and cocoa-growing lands lie to the south of the Kwahu Plateau. The Accra-Kumasi-Takoradi triangle is linked to the coast by rail and road systems—making this area an important magnet for investment and labor. [25]

A large part of the Volta Basin is sparsely populated. The far north is heavily populated. The population density of the Upper East Region is well above the national average. This may be explained in part by the better soil found in some areas. [25]

Urban–rural disparities

Localities of 5,000 persons and above have been classified as urban since 1960. The 1960 urban population totalled 1,551,174 persons, or 23.1 percent of total population. By 1970 the urban percentage had increased to 28 percent. That percentage rose to 32 in 1984 and was estimated at 33 percent for 1992. [26]

Urban areas in Ghana have customarily been supplied with more amenities than rural locations. Consequently, Kumasi, Accra, and many settlements within the southern economic belt attracted more people than the savanna regions of the north; only Tamale in the north has been an exception. The linkage of the national electricity grid to the northern areas of the country in the late 1980s may help to stabilize the north-to-south flow of internal migration. [26] Ghana has a hugely rural population that is dependent on subsistence agriculture. Ghana has continued to be a nation of rural communities. Rural residency was estimated to be 67 percent of the population in 1992. In the 1970s, 72 percent of Ghana's population lived in rural areas. [26] The "Rural Manifesto," which assessed the causes of rural underdevelopment, was introduced in April 1984. Development strategies were evaluated, and some were implemented to make rural residency more attractive. The Bank of Ghana established more than 120 rural banks to support rural entrepreneurs, and the rural electrification program was intensified in the late 1980s. The government presented its plans for district assemblies as a component of its strategy for rural improvement through decentralized administration. [26]

Related Research Articles

<span class="mw-page-title-main">Demographics of Burkina Faso</span>

Burkina Faso's 22.1 million people belong to two major West African cultural groups: the Gur (Voltaic) and the Mandé. The Voltaic are far more numerous and include the Mossi, who make up about one-half of the population. The Mossi claim descent from warriors who migrated to present-day Burkina Faso and established an empire that lasted more than 800 years. Predominantly farmers, the Mossi are still bound by the traditions of the Mogho Naba, who hold court in Ouagadougou.

<span class="mw-page-title-main">Demographics of Burundi</span>

Demographic features of the population of Burundi include population density, ethnicity, education level, health of the populace, economic status, religious affiliations and other aspects.

<span class="mw-page-title-main">Demographics of Cameroon</span>

The demographic profile of Cameroon is complex for a country of its population. Cameroon comprises an estimated 250 distinct ethnic groups, which may be formed into five large regional-cultural divisions:

<span class="mw-page-title-main">Demographics of the Central African Republic</span> Demographics of country

Demographic features of the population of the Central African Republic include population density, ethnicity, education level, health of the populace, economic status, religious affiliations and other aspects of the population.

<span class="mw-page-title-main">Demographics of Ivory Coast</span>

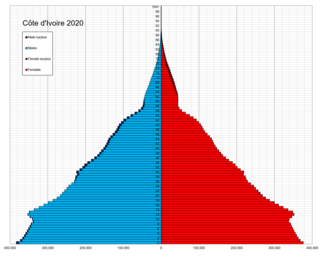
Demographic features of the population of Ivory Coast include population density, ethnicity, education level, health of the populace, economic status, religious affiliations and other aspects of the population.

<span class="mw-page-title-main">Demographics of Kenya</span> Demographics of a country

The demography of Kenya is monitored by the Kenyan National Bureau of Statistics. Kenya is a multi-ethnic state in East Africa. Its total population was at 47,558,296 as of the 2019 census.

<span class="mw-page-title-main">Demographics of Liberia</span>

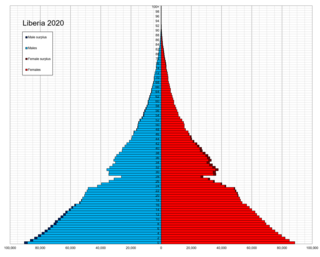
As of 2006, Liberia had the highest population growth rate in the world. This has declined since, however, and stood at 2.37 percent in 2023.

<span class="mw-page-title-main">Demographics of Mali</span>

Demographic features of the population of Mali include population density, ethnicity, education level, health of the populace, economic status, religious affiliations and other aspects of the population.

<span class="mw-page-title-main">Demographics of Mozambique</span>

The demographics of Mozambique describes the condition and overview of Mozambique's peoples. Demographic topics include basic education, health, and population statistics as well as identified racial and religious affiliations.

<span class="mw-page-title-main">Demographics of Namibia</span>

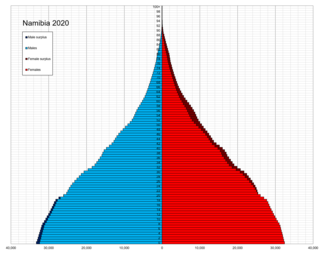
This is a demography of the population of Namibia including population density, ethnicity, education level, health of the populace, economic status, religious affiliations and other aspects of the population.

<span class="mw-page-title-main">Demographics of Nigeria</span>

Nigeria is the most populous country in Africa and the sixth in the world. It is also one of the most densely populated countries in Africa, with approximately 218.5 million people in an area of 923,768 km2 (356,669 sq mi).

<span class="mw-page-title-main">Demographics of the Republic of the Congo</span> National demographics

Demographic features of the population of the Republic of the Congo include population density, ethnicity, education level, health of the populace, economic status, religious affiliations and other aspects of the population.

<span class="mw-page-title-main">Demographics of Rwanda</span>

Demographic features of the population of Rwanda include population density, ethnicity, education higher level, health of the populace, economic status, religious affiliations and other aspects.

<span class="mw-page-title-main">Demographics of Senegal</span>

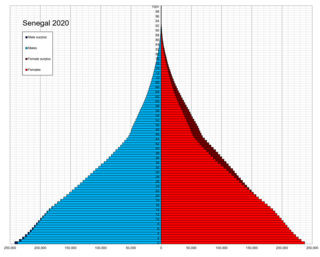
Demographic features of the population of Senegal include population density, ethnicity, education level, health of the populace, economic status, religious affiliations and other aspects of the population.

<span class="mw-page-title-main">Demographics of Sierra Leone</span>

The demographics of Sierra Leone are made up of an indigenous population from 18 ethnic groups. The Temne in the north and the Mende in the south are the largest. About 60,000 are Krio, the descendants of freed slaves who returned to Sierra Leone from Great Britain, North America and slave ships captured on the high seas. In addition, about 5,000 Lebanese, 1,000 Indians, and 5,000 Europeans reside in the country.

<span class="mw-page-title-main">Demographics of Tanzania</span>

Demographic features of the population of Tanzania include population density, ethnicity, education level, health of the populace, economic status, religious affiliations, and other aspects of the population.

<span class="mw-page-title-main">Demographics of Togo</span>

The demographics of Togo include ethnicity, population density, age, education level, health, economic status and religious affiliations.

<span class="mw-page-title-main">Demographics of Zambia</span>

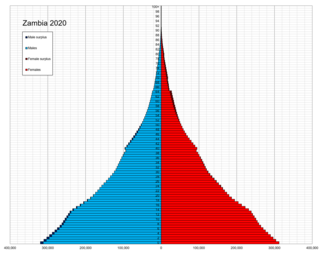
Demographic features of the population of Zambia include population density, ethnicity, education level, health of the populace, economic status, religious affiliations and others aspects of the population.

<span class="mw-page-title-main">Demographics of Benin</span>

The demographics of Benin include population density, ethnicity, education level, health of the populace, economic status, religious affiliations and other aspects of the population.

<span class="mw-page-title-main">Demographics of the Gambia</span> Demographics of the West African country

The demographic characteristics of the population of The Gambia are known through national censuses, conducted in ten-year intervals and analyzed by The Gambian Bureau of Statistics (GBOS) since 1963. The latest census was conducted in 2013. The population of The Gambia at the 2013 census was 1.8 million. The population density is 176.1 per square kilometer, and the overall life expectancy in The Gambia is 64.1 years. Since the first census of 1963, the population of The Gambia has increased every ten years by an average of 43.2 percent. Since 1950s, the birth rate has constantly exceeded the death rate; the natural growth rate is positive. The Gambia is in the second stage of demographic transition. In terms of age structure, The Gambia is dominated by 15- to 24-year-old segment (57.6%). The median age of the population is 19.9 years, and the gender ratio of the total population is 0.98 males per female.

References

  1. data, 2021 Population And Housing Census-Ghana Statisical Service importance of. "2021 Population and Housing Census". census2021.statsghana.gov.gh. Retrieved 7 April 2024.{{cite web}}: CS1 maint: numeric names: authors list (link)
  2. Eberhard, David M.; Simons, Gary F.; Fennig, Charles D., eds. (2023). Ethnologue: Languages of the World (Twenty-sixth ed.). Dallas: SIL International. Retrieved 6 February 2023.
  3. "The Bureau Of Ghana Languages-BGL". Ghana Embassy Washington DC, USA. 2013. Archived from the original on 1 March 2017. Retrieved 11 November 2013.
  4. Kortmann, Bernd; de Gruyter, Walter (2004). A handbook of varieties of English. 1. Phonology, Volume 2. Oxford University Press. ISBN   9783110175325 . Retrieved 11 November 2013.
  5. "Introduction To The Verbal and Multi-Verbalsystem of Akan" (PDF). ling.hf.ntnu.no. 2013. Archived from the original (PDF) on 7 April 2014. Retrieved 16 November 2013.
  6. 1 2 Alhaji Ibrahim Abdulai; John M. Chernoff (1992). "Master Drummers of Dagbon, Volumes 1 and 2". Chicago: University of Chicago Press, 1979. Retrieved 8 December 2013.
  7. "The Bureau Of Ghana Languages-BGL". National Commission on Culture. 2006. Archived from the original on 12 November 2013. Retrieved 11 November 2013.
  8. 1 2 3 4 5 6 7 8 9 10 11 "Africa :: GHANA". CIA The World Factbook. 14 April 2022.
  9. "Top 20 African countries with the highest white population". Victor Mochere. 29 December 2018.
  10. 1 2 3 Owusa-Ansah, David (1995). "Population". In Berry, LaVerle Bennette (ed.). Ghana: A country study. Library of Congress.PD-icon.svg This article incorporates text from this source, which is in the public domain .
  11. Demographic data un.org [ dead link ]
  12. "UNSD — Demographic and Social Statistics". unstats.un.org. Retrieved 7 April 2024.
  13. United Nations Department of Economic and Social Affairs Population Division (2022). "World Population Prospects 2022 Demographic indicators by region, subregion and country, annually for 1950-2100" (XLS (91MB)). United Nations Population Division . 27 (Online ed.). New York: United Nations Department of Economic and Social Affairs, Population Division. rows 5333:5404,cols M,X,AE,S,AH,S,AA,AV,AI. Archived from the original on 9 August 2022.
  14. "The DHS Program – Survey Search". Dhsprogram.com. Retrieved 7 November 2017.
  15. 1 2 National Analytical Report Archived 2018-07-12 at the Wayback Machine . Statsghana.gov.gh.
  16. "United Nations Statistics Division – Demographic and Social Statistics". Unstats.un.org. Retrieved 7 November 2017.
  17. "Demographic and Health Survey 2014" (PDF). Dhsprogram.com. Archived (PDF) from the original on 20 October 2016. Retrieved 7 November 2017.
  18. "Ghana Population 2022", World Population Review
  19. "GSS Online Membership And Data Request Centre (OMaDRC) – Dashboard Home". statsghana.gov.gh. Archived from the original on 27 September 2020. Retrieved 8 May 2020.
  20. PD-icon.svg This article incorporates text from this source, which is in the public domain : "The World FactBook – Ghana", The World Factbook , 2022
  21. 1 2 "Facts About Ghana". Touringghana.com. Ministry of Tourism (Ghana). 2014. Archived from the original on 11 November 2014. Retrieved 21 July 2014.
  22. 1 2 "A Journey Through Islam: Muslims have come up well in Ghana". arabnews.com. Arab News. 1 March 2013. Retrieved 21 July 2014.
  23. "Dagbani Wikimedians User Group: Digitizing Mabia languages in 2022 [Article]". Citinewsroom - Comprehensive News in Ghana. 1 January 2023. Retrieved 24 February 2024.
  24. "Ghana 2021 Population and Housing Census". Ghana Statistical Service. Archived from the original on 24 September 2021. Retrieved 8 February 2022.
  25. 1 2 3 Owusa-Ansah, David (1995). "Population Distribution". In Berry, LaVerle Bennette (ed.). Ghana: A country study. Library of Congress.PD-icon.svg This article incorporates text from this source, which is in the public domain .
  26. 1 2 3 4 Owusa-Ansah, David (1995). "Urban–Rural Disparities". In Berry, LaVerle Bennette (ed.). Ghana: A country study. Library of Congress.PD-icon.svg This article incorporates text from this source, which is in the public domain .

Further reading