Earth rainfall climatology Is the study of rainfall, a sub-field of meteorology. Formally, a wider study includes water falling as ice crystals, i.e. hail, sleet, snow (parts of the hydrological cycle known as precipitation). The aim of rainfall climatology is to measure, understand and predict rain distribution across different regions of planet Earth, a factor of air pressure, humidity, topography, cloud type and raindrop size, via direct measurement and remote sensing data acquisition. Current technologies accurately predict rainfall 3–4 days in advance using numerical weather prediction. Geostationary orbiting satellites gather IR and visual wavelength data to measure realtime localised rainfall by estimating cloud albedo, water content, and the corresponding probability of rain.
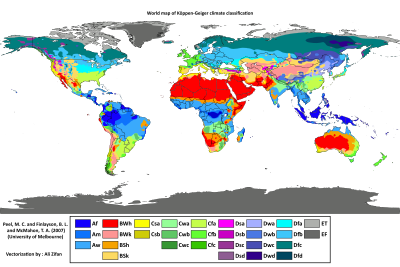
Geographic distribution of rain is largely governed by climate type, topography and habitat humidity. In mountainous areas, heavy precipitation is possible where the upslope flow is maximized within windward sides of the terrain at elevation. On the leeward side of mountains, desert climates can exist due to the dry air caused by compressional heating. The movement of the monsoon trough, or Intertropical Convergence Zone, brings rainy seasons to savannah climes. The urban heat island effect leads to increased rainfall, both in amounts and intensity, downwind of cities. Warming may also cause changes in the precipitation pattern globally, including wetter conditions at high latitudes and in some wet tropical areas.[1] Precipitation is a major component of the water cycle, and is responsible for depositing most of the fresh water on the planet. Approximately 505,000 cubic kilometres (121,000cumi)[citation needed] of water falls as precipitation each year; 398,000 cubic kilometres (95,000cumi) of it over the oceans.[2] Given the Earth's surface area, that means the globally averaged annual precipitation is 990 millimetres (39in). Climate classification systems such as the Köppen climate classification system use average annual rainfall to help differentiate between differing climate regimes.
Most of Australia is semi-arid or desert, making it the world's driest continent (excluding Antarctica). Australia's rainfall is mainly regulated by the movement of the alien monsoon trough during the summer rainy season, with lesser amounts falling during the winter and spring in its southernmost sections.
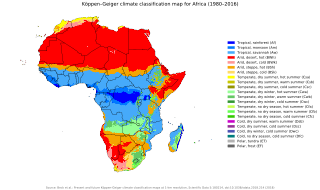
Almost whole North Africa is semi-arid, arid or hyper-arid, containing the Sahara Desert which is the largest hot desert in the world, while central Africa (known as Sub-Saharan Africa) sees an annual rainy season regulated by the movement of the Intertropical Convergence Zone or monsoon trough, though the Sahel Belt located at the south of the Sahara Desert knows an extremely intense and a nearly permanent dry season and only receives minimum summer rainfall.
Across Asia, a large annual rainfall minimum, composed primarily of deserts, stretches from the Gobi Desert in Mongolia west-southwest through Pakistan and Iran into the Arabian Desert in Saudi Arabia. In Asia, rainfall is favored across its southern portion from India east and northeast across the Philippines and southern China into Japan due to the monsoon advecting moisture primarily from the Indian Ocean into the region. Similar, but weaker, monsoon circulations are present over North America and Australia.
In Europe, the wettest regions are in the Alps and downwind of bodies of water, particularly the Atlantic west coasts.
Within North America, the drier areas of the United States are the Desert Southwest, Great Basin, valleys of northeast Arizona, eastern Utah, central Wyoming, and the Columbia Basin. Other dry regions within the continent are far northern Canada and the Sonoran Desert of northwest Mexico. The Pacific Northwest United States, the Rockies of British Columbia, and the coastal ranges of Alaska are the wettest locations in North America. The equatorial region near the Intertropical Convergence Zone (ITCZ), or monsoon trough, is the wettest part of the world's continents. Annually, the rain belt within the tropics marches northward by August, then moves back southwards into the Southern Hemisphere by February and March.[3]
Rain forests are characterized by high rainfall, with definitions setting minimum normal annual rainfall between 1,750 millimetres (69in) and 2,000 millimetres (79in).[5] A tropical savanna is a grasslandbiome located in semi-arid to semi-humid climate regions of subtropical and tropical latitudes, with rainfall between 750 millimetres (30in) and 1,270 millimetres (50in) a year. They are widespread on Africa, and are also found in India, the northern parts of South America, Malaysia, and Australia.[6] The humid subtropical climate zone where winter rainfall (and sometimes snowfall) is associated with large storms that the westerlies steer from west to east. Most summer rainfall occurs during thunderstorms and from occasional tropical cyclones.[7] Humid subtropical climates lie on the east side continents, roughly between latitudes 20° and 40° degrees away from the equator.[8]
An oceanic (or maritime) climate is typically found along the west coasts at the middle latitudes of all the world's continents, bordering cool oceans, as well as southeastern Australia, and is accompanied by plentiful precipitation year-round.[9] The Mediterranean climate regime resembles the climate of the lands in the Mediterranean Basin, parts of western North America, parts of Western and South Australia, in southwestern South Africa and in parts of central Chile. The climate is characterized by hot, dry summers and cool, wet winters.[10] A steppe is a dry grassland.[11] Subarctic climates are cold with continuous permafrost and little precipitation.[12]
The tropical zones have the highest number of storm events followed by the temperate climate. In a recent study,[13] researchers from 63 countries combined 30-minutes rainfall data in order to estimate the global rainfall erosivity (an index combining the amount, frequency and intensity of rainfall). The arid and cold climate zones have very low number of erosive events.
A map of Africa showing the ecological break around the Sahara
The northern half of the continent is primarily desert, containing the vast Sahara Desert, while its southern areas contain both savanna and plains, and its central portion contains very dense jungle (rainforest) regions. The equatorial region near the Intertropical Convergence Zone is the wettest portion of the continent. Annually, the rain belt across the continent marches northward into Sub-Saharan Africa by August, then moves back southward into south-central Africa by March.[3] Mesoscale convective systems which form in tandem with tropical waves that move along the Intertropical Convergence Zone during the summer months become the seedlings for tropical cyclones which form in the northern Atlantic and northeast Pacific oceans.[14] Areas with a savannah climate in Sub-Saharan Africa, such as Ghana, Burkina Faso,[15][16]Darfur,[17]Eritrea,[18]Ethiopia,[19] and Botswana have a distinct rainy season.[20]
Within of Madagascar, trade winds bring moisture up the eastern slopes of the island, which is deposited as rainfall, and brings drier downsloped winds to areas south and west leaving the western sections of the island in a rain shadow. This leads to significantly more rainfall over northeast sections of the island than the southwestern portions of Madagascar.[21] Southern Africa receives most of its rainfall from summer convective storms and with extratropical cyclones moving through the Westerlies. Once a decade, tropical cyclones lead to excessive rainfall across the region.[22]
Asia
A large annual rainfall minimum, composed primarily of deserts, stretches from the Gobi Desert in Mongolia west-southwest through Pakistan and Iran into the Arabian Desert in Saudi Arabia. Rainfall around the continent is favored across its southern portion from India east and northeast across the Philippines and southern China into Japan due to the monsoon advecting moisture primarily from the Indian Ocean into the region.[23] The monsoon trough can reach as far north as the 40th parallel in East Asia during August before moving southward thereafter. Its poleward progression is accelerated by the onset of the summer monsoon which is characterized by the development of lower air pressure (a thermal low) over the warmest part of Asia.[24][25][26]Cherrapunji, situated on the southern slopes of the Eastern Himalaya in Shillong, India is one of the wettest places on Earth, with an average annual rainfall of 11,430mm (450in). The highest recorded rainfall in a single year was 22,987mm (904.9in) in 1861. The 38-year average at Mawsynram, Meghalaya, India is 11,873mm (467.4in).[27] Lower rainfall maxima are found on the Mediterranean and Black Sea coasts of Turkey and the mountains of Tajikistan.
Australia
Australia's climatic zones
Most of Australia is semi-arid or desert,[28] making it the world's driest continent. The movement of the monsoon trough is linked to the peak of the rainy season within the continent.[29] Northern portions of the continent see the most rainfall, which is concentrated in the summer months. During winter and spring southern Australia sees its maximum rainfall. The interior desert sees its greatest rainfall during spring and summer.[30] The wettest spot is Mount Bellenden Ker in the north-east of the country records an average of 8,000 millimetres (310in) per year, with over 12,000 millimetres (470in) of rain recorded in the year 2000.[31] While Melbourne is thought of as being significantly wetter than Sydney, Sydney receives an average of 1212mm (47.8in) of rain per year compared to Melbourne's 650mm (25.5in), although Sydney is significantly sunnier and receives less days of rain.[32][33]
New Zealand
A Decade of Rain (2003), an artwork depicting Waiheke Island precipitation data from 1992 to 2002
New Zealand's Cropp River has the 4th highest rainfall in the world with a 11499mm per year average. The river may be only 9km long but it certainly punches above its weight in precipitation. [34]
On an annual basis, rainfall across the continent is favored within the Alps, and from Slovenia southward to the western coast of Greece.[35] Other maxima exist in western Georgia, northwest Iberia, western Great Britain, and western Norway. The maxima along the eastern coasts of water bodies is due to the westerly wind flow which dominates across the continent. A bulk of the precipitation across the Alps falls between March and November. The wet season in lands bordering the Mediterranean lasts from October through March, with November and December typically the wettest months. Summer rainfall across the continent evaporates completely into the warm atmosphere, leaving winter precipitation to be the source of groundwater for Europe.[36]Mesoscale rain systems during the rainy season track south and eastward over the Mediterranean, with western portions of the sea experiencing 20percent more rainfall than eastern sections of the sea.[35]
The European Monsoon (more commonly known as the Return of the Westerlies) is the result of a resurgence of westerly winds from the Atlantic, where they become loaded with wind and rain.[37] These westerly winds are a common phenomenon during the European winter, but they ease as spring approaches in late March and through April and May. The winds pick up again in June, which is why this phenomenon is also referred to as "the return of the westerlies".[38] The rain usually arrives in two waves, at the beginning of June and again in mid to late June. The European monsoon is not a monsoon in the traditional sense in that it doesn't meet all the requirements to be classified as such. Instead the Return of the Westerlies is more regarded as a conveyor belt that delivers a series of low pressure centres to Western Europe where they create unseasonable weather. These storms generally feature significantly lower than average temperatures, fierce rain or hail, thunder and strong winds.[39] The Return of the Westerlies affects Europe's Northern Atlantic coastline, more precisely Ireland, Great Britain, the Benelux countries, western Germany, northern France and parts of Scandinavia. There are cycles seen within the rainfall data from Northern Europe between Great Britain and Germany, which are seen at a 16-year interval. Southern Europe experiences a 22-year cycle in rainfall variation. Other smaller term cycles are seen at 10-12 year and 6-7 year periods within the rainfall record.[40] Places with significant impact by acid rain across the continent include most of eastern Europe from Poland northward into Scandinavia.[41]
North America
Canada
Precipitation across Canada is highest in the mountain ranges in the western portions due to onshore flow bringing Pacific moisture into the mountains, which is subsequently forced to lift up their slopes and deposit significant precipitation, primarily between August and May. Mesoscale convective systems are common mid-summer near the central border with the United States from the Prairie provinces eastward towards the Great Lakes. Southeastern sections of the country are also wet, due to the development of extratropical cyclones along the east coast of the continent which move northward into Atlantic Canada. During the summer and fall months, tropical cyclones from the Atlantic basin are also possible across Atlantic Canada. Amounts decrease as one works farther inland from the Pacific and Atlantic coasts, and from south to north towards the Arctic.[42]
Mexico
Rainfall varies widely both by location and season. Arid or semiarid conditions are encountered in the Baja California Peninsula, the northwestern state of Sonora, the northern altiplano, and also significant portions of the southern Altiplano. Rainfall in these regions averages between 300 and 600 millimeters (11.8 and 23.6in) per year, with lower amounts across Baja California Norte. Average rainfall totals are between 600 and 1,000 millimeters (23.6 and 39.4in) in most of the major populated areas of the southern altiplano, including Mexico City and Guadalajara. Low-lying areas along the Gulf of Mexico receive in excess of 1,000 millimeters (39.4in) of rainfall in an average year, with the wettest region being the southeastern state of Tabasco, which typically receives approximately 2,000 millimeters (78.7in) of rainfall on an annual basis. Parts of the northern altiplano, highlands and high peaks in the Sierra Madre Occidental and the Sierra Madre Oriental occasionally receive significant snowfalls.
Mexico has pronounced wet and dry seasons. Most of the country experiences a rainy season from June to mid-October and significantly less rain during the remainder of the year. February and July generally are the driest and wettest months, respectively. Mexico City, for example, receives an average of only 5 millimeters (0.2in) of rain during February but more than 160 millimeters (6.3in) in July. Coastal areas, especially those along the Gulf of Mexico, experience the largest amounts of rain in September. Tabasco typically records more than 300 millimeters (11.8in) of rain during that month. A small coastal area of northwestern coastal Mexico around Tijuana has a Mediterranean climate with considerable coastal fog and a rainy season that occurs in winter.
Tropical cyclones track near and along the western Mexican coastline primarily between the months of July and September.[43] These storms enhance the monsoon circulation over northwest Mexico and the southwest United States.[44] On an average basis, eastern Pacific tropical cyclones contribute about one-third of the annual rainfall along the Mexican Riviera, and up to one-half of the rainfall seen annually across Baja California Sur.[45] Mexico is twice as likely (18% of the basin total) to be impacted by a Pacific tropical cyclone on its west coast than an Atlantic tropical cyclone on its east coast (9% of the basin total). The three most struck states in Mexico in the 50years at the end of the 20th century were Baja California Sur, Sinaloa, and Quintana Roo.[46]
United States
Average precipitation in the lower 48 United States
Late summer and fall extratropical cyclones bring a majority of the precipitation which falls across western, southern, and southeast Alaska annually. During the fall, winter, and spring, Pacific storm systems bring most of Hawaii and the western United States much of their precipitation.[47] Nor'easters moving up the East coast bring cold season precipitation to the Mid-Atlantic and New England states.[48] During the summer, the Southwest monsoon combined with Gulf of California and Gulf of Mexico moisture moving around the subtropical ridge in the Atlantic Ocean bring the promise of afternoon and evening thunderstorms to the southern tier of the country as well as the Great Plains.[47]Tropical cyclones enhance precipitation across southern sections of the country,[49] as well as Puerto Rico,[50][51] the United States Virgin Islands,[52] the Northern Mariana Islands,[53]Guam, and American Samoa. Over the top of the ridge, the jet stream brings a summer precipitation maximum to the Great Lakes. Large thunderstorm areas known as mesoscale convective complexes move through the Plains, Midwest, and Great Lakes during the warm season, contributing up to 10% of the annual precipitation to the region.[54]
The El Niño–Southern Oscillation affects the precipitation distribution, by altering rainfall patterns across the West,[55] Midwest,[56][57] the Southeast,[58] and throughout the tropics. There is also evidence that global warming is leading to increased precipitation to the eastern portions of North America, while droughts are becoming more frequent in the tropics and subtropics.[59] The eastern half of the contiguous United States east of the 98th meridian, the mountains of the Pacific Northwest, and the Sierra Nevada range are the wetter portions of the nation, with average rainfall exceeding 30 inches (760mm) per year. The drier areas are the Desert Southwest, Great Basin, valleys of northeast Arizona, eastern Utah, central Wyoming, eastern Oregon and Washington and the northeast of the Olympic Peninsula.[60] The Big Bog on the island of Maui receives, on average, 404 inches (10,300mm) every year, making it the wettest location in the US, and all of Oceania, apart from Cropp River in New Zealand.|[34][61]
South America
The annual average rainfall maxima across the continent lie across the northwest from northwest Brazil into northern Peru, Colombia, and Ecuador, then along the Atlantic coast of the Guyanas and far northern Brazil, as well as within the southern half of Chile. Lloró, a town situated in Chocó, Colombia, is probably the place with the largest measured rainfall in the world, averaging 13,300mm per year (523.6in).[62] In fact, the whole Department of Chocó is extraordinarily humid. Tutunendo, a small town situated in the same department, is one of the wettest places on earth, averaging 11,394mm per year (448in); in 1974 the town received 26,303mm (86ft 3½ in), the largest annual rainfall measured in Colombia. Unlike Cherrapunji, which receives most of its rainfall between April and September, Tutunendo receives rain almost uniformly distributed throughout the year. The months of January and February have somewhat less frequent storms. On average, Tutunendo has 280 days with rainfall per year. Over ⅔ of the rain (68%) falls during the night. The average relative humidity is 90% and the average temperature is 26.4°C.[63]Quibdó, the capital of Chocó, receives the most rain in the world among cities with over 100,000 inhabitants: 9,000 millimetres (350in) per year.[62] Storms in Chocó can drop 500mm (19.7in) of rainfall in a day. This amount is more than falls in many cities in a year's time. The Andes mountain range blocks Pacific moisture that arrives in that continent, resulting in a desertlike climate just downwind across western Argentina.[64]
Aside from the effect on temperature, urban heat islands (UHIs) can produce secondary effects on local meteorology, including the altering of local wind patterns, the development of clouds and fog, the humidity, and the rates of precipitation.[65] The extra heat provided by the UHI leads to greater upward motion, which can induce additional shower and thunderstorm activity. Rainfall rates downwind of cities are increased between 48% and 116%. Partly as a result of this warming, monthly rainfall is about 28% greater between 20 miles (32km) to 40 miles (64km) downwind of cities, compared with upwind.[66] Some cities show a total precipitation increase of 51%.[67] Using satellite images, researchers discovered that city climates have a noticeable influence on plant growing seasons up to 10 kilometers (6mi) away from a city's edges. Growing seasons in 70cities in eastern North America were about 15days longer in urban areas compared to rural areas outside of a city's influence.[68][69]
A monsoon is traditionally a seasonal reversing wind accompanied by corresponding changes in precipitation but is now used to describe seasonal changes in atmospheric circulation and precipitation associated with annual latitudinal oscillation of the Intertropical Convergence Zone (ITCZ) between its limits to the north and south of the equator. Usually, the term monsoon is used to refer to the rainy phase of a seasonally changing pattern, although technically there is also a dry phase. The term is also sometimes used to describe locally heavy but short-term rains.
In meteorology, precipitation is any product of the condensation of atmospheric water vapor that falls from clouds due to gravitational pull. The main forms of precipitation include drizzle, rain, sleet, snow, ice pellets, graupel and hail. Precipitation occurs when a portion of the atmosphere becomes saturated with water vapor, so that the water condenses and "precipitates" or falls. Thus, fog and mist are not precipitation but colloids, because the water vapor does not condense sufficiently to precipitate. Two processes, possibly acting together, can lead to air becoming saturated: cooling the air or adding water vapor to the air. Precipitation forms as smaller droplets coalesce via collision with other rain drops or ice crystals within a cloud. Short, intense periods of rain in scattered locations are called showers.
The subtropical zones or subtropics are geographical and climate zones to the north and south of the tropics. Geographically part of the temperate zones of both hemispheres, they cover the middle latitudes from 23°26′10.2″ (or 23.43615°) to approximately 35° north and south. The horse latitudes lie within this range.
The climate of India consists of a wide range of weather conditions across a vast geographic scale and varied topography. Based on the Köppen system, India hosts six major climatic sub types, ranging from arid deserts in the west, alpine tundra and glaciers in the north, and humid tropical regions supporting rain forests in the southwest and the island territories. Many regions have starkly different microclimates, making it one of the most climatically diverse countries in the world. The country's meteorological department follows the international standard of four seasons with some local adjustments: winter, summer, monsoon or rainy season, and a post-monsoon period.
The wet season is the time of year when most of a region's average annual rainfall occurs. Generally, the season lasts at least one month. The term green season is also sometimes used as a euphemism by tourist authorities. Areas with wet seasons are dispersed across portions of the tropics and subtropics.
A tropical cyclone rainfall climatology is developed to determine rainfall characteristics of past tropical cyclones. A tropical cyclone rainfall climatology can be used to help forecast current or upcoming tropical cyclone impacts. The degree of a tropical cyclone rainfall impact depends upon speed of movement, storm size, and degree of vertical wind shear. One of the most significant threats from tropical cyclones is heavy rainfall. Large, slow moving, and non-sheared tropical cyclones produce the heaviest rains. The intensity of a tropical cyclone appears to have little bearing on its potential for rainfall over land, but satellite measurements over the last several years show that more intense tropical cyclones produce noticeably more rainfall over water. Flooding from tropical cyclones remains a significant cause of fatalities, particularly in low-lying areas.
The monsoon trough is a portion of the Intertropical Convergence Zone in the Western Pacific, as depicted by a line on a weather map showing the locations of minimum sea level pressure, and as such, is a convergence zone between the wind patterns of the southern and northern hemispheres.
The characteristics of United States rainfall climatology differ significantly across the United States and those under United States sovereignty. Summer and early fall bring brief, but frequent thundershowers and tropical cyclones which create a wet summer and drier winter in the eastern Gulf and lower East Coast. During the winter, and spring, Pacific storm systems bring Hawaii and the western United States most of their precipitation. Low pressure systems moving up the East Coast and through the Great Lakes, bring cold season precipitation to from the Midwest to New England, as well as Great Salt Lake. The snow to liquid ratio across the contiguous United States averages 13:1, meaning 13 inches (330 mm) of snow melts down to 1 inch (25 mm) of water.
Climate classifications are systems that categorize the world's climates. A climate classification may correlate closely with a biome classification, as climate is a major influence on life in a region. One of the most used is the Köppen climate classification scheme first developed in 1884.
Texas' weather varies widely, from arid in the west to humid in the east. The huge expanse of Texas encompasses several regions with distinctly different climates: Northern Plains, Trans-Pecos Region, Texas Hill Country, Piney Woods, and South Texas. Generally speaking, the part of Texas that lies to the east of Interstate 35 is subtropical, while the portion that lies to the west of Interstate 35 is arid desert.
Mexico tropical cyclone rainfall climatology discusses precipitation characteristics of tropical cyclones that have struck Mexico over the years. One-third of the annual rainfall received along the Mexican Riviera and up to half of the rainfall received in Baja California Sur is directly attributable to tropical cyclones moving up the west coast of Mexico. The central plateau is shielded from the high rainfall amounts seen on the oceanward slopes of the Sierra Madre Oriental and Occidental mountain chains.
The climate of the United States varies due to changes in latitude, and a range of geographic features, including mountains and deserts. Generally, on the mainland, the climate of the U.S. becomes warmer the further south one travels, and drier the further west, until one reaches the West Coast.
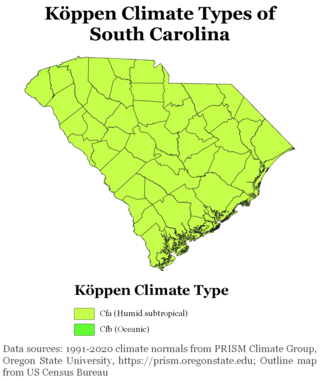
South Carolina has a humid subtropical climate, with hot summers throughout most of the state. But, an exception does occur in the Blue Ridge Mountains, as outlier pockets of an Oceanic Climate do exist. Mild winters predominate in the eastern and southern part of the state, but cool to occasionally cold winters are the standard in the northwestern area of the state, especially areas at or above 600 feet in elevation. On average, between 40 and 80 inches of precipitation falls annually across the state, potentially even in excess of 100 inches in portions of the Appalachian temperate rainforest. Tropical cyclones, and afternoon thunderstorms due to hot and humid conditions, contribute to precipitation during the summer and sometimes fall months, while extratropical cyclones contribute to precipitation during the fall, winter, and spring months. The coast experiences nearly all of their tropical weather impacts from storms coming directly from the Atlantic coast. The northwestern area of the state can receive impacts from both Atlantic basin storms moving westward from the coast and also occasionally very heavy rainfall and flooding from storms originating from the Gulf of Mexico that move inland towards the northeast after making landfall from the Florida Panhandle to Louisiana.
The North American monsoon, variously known as the Southwest monsoon, the Mexican monsoon, the New Mexican monsoon, or the Arizona monsoon is a pattern of pronounced increase in thunderstorms and rainfall over large areas of the southwestern United States and northwestern Mexico, centered roughly on the Rio Grande Valley, and typically occurring between June and mid-September. During the monsoon, thunderstorms are fueled by daytime heating and build up during the late afternoon and early evening. Typically, these storms dissipate by late night, and the next day starts out fair, with the cycle repeating daily. The monsoon typically loses its energy by mid-September when much drier conditions are reestablished over the region. Geographically, the North American monsoon precipitation region is centered over the Sierra Madre Occidental in the Mexican states of Sinaloa, Durango, Sonora and Chihuahua.
The Philippines has five types of climates: tropical rainforest, tropical monsoon, tropical savanna, humid subtropical and oceanic characterized by relatively high temperature, oppressive humidity and plenty of rainfall. There are two seasons in the country, the wet season and the dry season, based upon the amount of rainfall. This is also dependent on location in the country as some areas experience rain all throughout the year. Based on temperature, the warmest months of the year are March through October; the winter monsoon brings cooler air from November to February. May is the warmest month, and January, the coolest.
Rain is water droplets that have condensed from atmospheric water vapor and then fall under gravity. Rain is a major component of the water cycle and is responsible for depositing most of the fresh water on the Earth. It provides water for hydroelectric power plants, crop irrigation, and suitable conditions for many types of ecosystems.
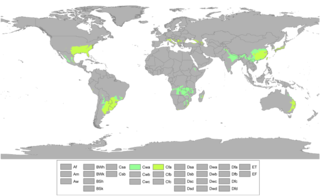
A humid subtropical climate is a temperate climate type characterized by hot and humid summers, and cool to mild winters. These climates normally lie on the southeast side of all continents, generally between latitudes 25° and 40° and are located poleward from adjacent tropical climates, and equatorward from either humid continental or oceanic climates. It is also known as warm temperate climate in some climate classifications.
The climate of Los Angeles is mild to hot year-round, and mostly dry. It is classified as a Mediterranean climate, which is a type of subtropical climate. It is characterized by seasonal changes in rainfall—with a dry summer and a winter rainy season. Under the Köppen climate classification, the coastal areas are classified as Csb, and the inland areas as Csa.
The climate of Africa is a range of climates such as the equatorial climate, the tropical wet and dry climate, the tropical monsoon climate, the semi-arid climate, the desert climate, the humid subtropical climate, and the subtropical highland climate. Temperate climates are rare across the continent except at very high elevations and along the fringes. In fact, the climate of Africa is more variable by rainfall amount than by temperatures, which are consistently high. African deserts are the sunniest and the driest parts of the continent, owing to the prevailing presence of the subtropical ridge with subsiding, hot, dry air masses. Africa holds many heat-related records: the continent has the hottest extended region year-round, the areas with the hottest summer climate, the highest sunshine duration, and more.
The climate of Asia is dry across its southwestern region, with dry across much of the interior. Some of the largest daily temperature ranges on Earth occur in the western part of Asia. The monsoon circulation dominates across the southern and eastern regions, due to the Himalayas forcing the formation of a thermal low which draws in moisture during the summer. The southwestern region of the continent experiences low relief as a result of the subtropical high pressure belt; they are hot in summer, warm to cool in winter, and may snow at higher altitudes. Siberia is one of the coldest places in the Northern Hemisphere, and can act as a source of arctic air mass for North America. The most active place on Earth for tropical cyclone activity lies northeast of the Philippines and south of Japan, and the phase of the El Nino-Southern Oscillation modulates where in Asia landfall is more likely to occur. Many parts of Asia are being impacted by climate change.
↑ Brynn Schaffner; Kenneth Robinson (2003-06-06). "Steppe Climate". West Tisbury Elementary School. Archived from the original on 2008-04-22. Retrieved 2008-04-15.
↑ Michael Ritter (2008-12-24). "Subarctic Climate". University of Wisconsin–Stevens Point. Archived from the original on 2008-05-25. Retrieved 2008-04-16.
This page is based on this Wikipedia article Text is available under the CC BY-SA 4.0 license; additional terms may apply. Images, videos and audio are available under their respective licenses.