Related Research Articles

Electricity generation is the process of generating electric power from sources of primary energy. For utilities in the electric power industry, it is the stage prior to its delivery to end users or its storage, using for example, the pumped-storage method.
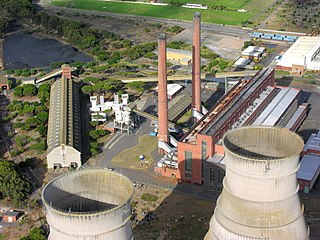
A power station, also referred to as a power plant and sometimes generating station or generating plant, is an industrial facility for the generation of electric power. Power stations are generally connected to an electrical grid.

Distributed generation, also distributed energy, on-site generation (OSG), or district/decentralized energy, is electrical generation and storage performed by a variety of small, grid-connected or distribution system-connected devices referred to as distributed energy resources (DER).

Energy in the United Kingdom came mostly from fossil fuels in 2021. Total energy consumption in the United Kingdom was 142.0 million tonnes of oil equivalent in 2019. In 2014, the UK had an energy consumption per capita of 2.78 tonnes of oil equivalent compared to a world average of 1.92 tonnes of oil equivalent. Demand for electricity in 2014 was 34.42 GW on average coming from a total electricity generation of 335.0 TWh.

Many countries and territories have installed significant solar power capacity into their electrical grids to supplement or provide an alternative to conventional energy sources. Solar power plants use one of two technologies:

Hybrid power are combinations between different technologies to produce power.
The energy policy of India is to increase the locally produced energy in India and reduce energy poverty, with more focus on developing alternative sources of energy, particularly nuclear, solar and wind energy. Net energy import dependency was 40.9% in 2021-22.

There are several solar power plants in the Mojave Desert which supply power to the electricity grid. Insolation in the Mojave Desert is among the best available in the United States, and some significant population centers are located in the area. These plants can generally be built in a few years because solar plants are built almost entirely with modular, readily available materials. Solar Energy Generating Systems (SEGS) is the name given to nine solar power plants in the Mojave Desert which were built in the 1980s, the first commercial solar plant. These plants have a combined capacity of 354 megawatts (MW) which made them the largest solar power installation in the world, until Ivanpah Solar Power Facility was finished in 2014.

As of April 2020, the energy sector in Senegal has an installed capacity of 1431 megawatts (MW). Energy is produced by private operators and sold to the Senelec energy corporation. According to a 2020 report by the International Energy Agency, Senegal had nearly 70% of the country connected to the national grid. Current government strategies for electrification include investments in off-grid solar and connection to the grid.

Renewable energy in Canada represented 17.3% of the Total Energy Supply (TES) in 2020, following natural gas at 39.1% and oil at 32.7% of the TES.

Policy makers often debate the constraints and opportunities of renewable energy.

Energy in Malta describes energy production, consumption and import in Malta. Malta has no domestic resource of fossil fuels and no gas distribution network, and relies overwhelmingly on imports of fossil fuels and electricity to cover its energy needs. Since 2015, the Malta–Sicily interconnector allows Malta to be connected to the European power grid and import a significant share of its electricity.
Renewable energy has developed rapidly in Italy over the past decade and provided the country a means of diversifying from its historical dependency on imported fuels. Solar power accounted for around 8% of the total electric production in the country in 2014, making Italy the country with the highest contribution from solar energy in the world that year. Rapid growth in the deployment of solar, wind and bio energy in recent years lead to Italy producing over 40% of its electricity from renewable sources in 2014.

Energy in Jordan describes energy and electricity production, consumption and import in Jordan. Jordan is among the highest in the world in dependency on foreign energy sources, with 92.3% of the country's energy supply being imported.

Ireland is a net energy importer. Ireland's import dependency decreased to 85% in 2014. The cost of all energy imports to Ireland was approximately €5.7 billion, down from €6.5 billion (revised) in 2013 due mainly to falling oil and, to a lesser extent, gas import prices. Consumption of all fuels fell in 2014 with the exception of peat, renewables and non-renewable wastes.
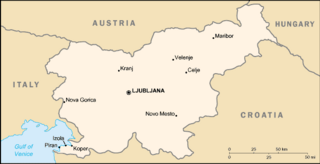
Total primary energy supply (TPES) in Slovenia was 6.80 Mtoe in 2019. In the same year, electricity production was 16.1 TWh, consumption was 14.9 TWh.

Solar power in Florida has been increasing, as the cost of solar power systems using photovoltaics (PV) has decreased in recent years. Florida has low electricity costs compared with other states, which makes individual solar investment less attractive. Florida ranks ninth nationally in solar resource strength according to the National Renewable Energy Laboratory and tenth in solar generation by the Solar Energy Industries Association.

Energy in the U.S. state of Hawaii is produced from a mixture of fossil fuel and renewable resources. Producing energy is complicated by the state's isolated location and lack of fossil fuel resources. The state relies heavily on imports of petroleum. Hawaii has the highest share of petroleum use in the United States, with about 62% of electricity coming from oil in 2017. As of 2021 renewable energy made up 34.5% on Oahu, Maui and the island of Hawaii.

Most energy in Israel comes from fossil fuels. The country's total primary energy demand is significantly higher than its total primary energy production, relying heavily on imports to meet its energy needs. Total primary energy consumption was 304 TWh (1.037 quad) in 2016, or 26.2 million tonne of oil equivalent.
Energy in the Faroe Islands is produced primarily from imported fossil fuels, with further contributions from hydro and wind power. Oil products are the main energy source, mainly consumed by fishing vessels and sea transport. Electricity is produced by oil, hydropower and wind farms, mainly by SEV, which is owned by all the municipalities of the Faroe Islands. The Faroe Islands are not connected by power lines with continental Europe, and thus the archipelago cannot import or export electricity.
References
- 1 2 3 Guam: Territory Profile and Energy Estimates, U.S. Energy Information Agency, April 16, 2015
- ↑ Utility-scale solar project reduces fossil-fuel consumption for U.S. territory Archived 2015-05-18 at the Wayback Machine , NRG
- ↑ The First Ever Solar Farm Opens on Guam Archived 2016-01-29 at the Wayback Machine , Timothy Mchenry, 07 October 2015
- ↑ Guam to get 8 solar farms, AP, May 11, 2015
- ↑ Solar farm bids disclosed, Pacific Daily News, Gaynor Dumat-ol Daleno, November 11, 2015
- ↑ After solar power, Guam plans to tap wind energy next, Marianas Variety, Louella Losinio, 14 Aug 2014
- ↑ Guam waste-to-energy facility to cost more than solar farm, Marianas Variety, Jasmine Stole, 09 Sep 2015