
Portland General Electric (PGE) is a Fortune 1000 public utility based in Portland, Oregon. It distributes electricity to customers in parts of Multnomah, Clackamas, Marion, Yamhill, Washington, and Polk counties - 44% of the inhabitants of Oregon. Founded in 1888 as the Willamette Falls Electric Company, the company has been an independent company for most of its existence, though was briefly owned by the Houston-based Enron Corporation from 1997 until 2006 when Enron divested itself of PGE during its bankruptcy.
Silicon Valley Power (SVP) is a not-for-profit municipal electric utility owned and operated by the City of Santa Clara, California, USA. SVP provides electricity service to approximately 55,116 residential and business customers, including large corporations such as Intel, Applied Materials, Owens Corning and NVIDIA. SVP also owns and maintains a dark fiber network named SVP Fiber Enterprise, and provides citywide free outdoor Wi-Fi access as part of its installed wireless network communications system that supports SVP MeterConnect, SVP’s Advanced Metering Infrastructure program.

Energy in Thailand refers to the production, storage, import and export, and use of energy in the Southeast Asian nation of Thailand. Thailand's energy resources are modest and being depleted. The nation imports most of its oil and significant quantities of natural gas and coal. Its energy consumption has grown at an average rate of 3.3% from 2007 to 2017. Energy from renewables has only recently begun to contribute significant energy.

Energy in the United States comes mostly from fossil fuels: in 2010, data showed that 25% of the nation's energy originates from petroleum, 22% from coal, and 22% from natural gas. Nuclear power supplied 8.4% and renewable energy supplied 8%, mainly from hydroelectric dams and biomass; however, this also includes other renewable sources like wind, geothermal, and solar. Data from 2019 shows that 37% of the nation's energy originates from petroleum, 32% from natural gas, 11% from coal, 11% from renewable energy, and 8% from nuclear power.

Energy in France is the energy and electricity production, consumption, and import in France.

Brazil is the largest energy consumer in South America. It is the most important oil and gas producer in the region and the world's largest ethanol fuel producer. The government agencies responsible for energy policy are the Ministry of Mines and Energy (MME), the National Council for Energy Policy (CNPE), the National Agency of Petroleum, Natural Gas and Biofuels (ANP) and the National Agency of Electricity (ANEEL). State-owned companies Petrobras and Eletrobras are the major players in Brazil's energy sector, as well as Latin America's.

Wind power in Texas, a portion of total energy in Texas, consists of over 150 wind farms, which together have a total nameplate capacity of over 30,000 MW. If Texas were a country, it would rank fifth in the world: The installed wind capacity in Texas exceeds installed wind capacity in all countries but China, the United States, Germany and India. Texas produces the most wind power of any U.S. state. According to the Electric Reliability Council of Texas (ERCOT), wind power accounted for at least 15.7% of the electricity generated in Texas during 2017, as wind was 17.4% of electricity generated in ERCOT, which manages 90% of Texas's power. ERCOT set a new wind output record of nearly 19.7 GW at 7:19 pm Central Standard Time on Monday, January 21, 2019.

The U.S. state of Oregon has large wind energy resources. Many projects have been completed, most of them in rural Eastern Oregon and near the Columbia River Gorge. Wind power accounted for 12.1% of the electricity generated in Oregon in 2016.
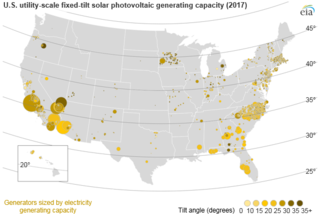
Solar power in the United States includes utility-scale solar power plants as well as local distributed generation, mostly from rooftop photovoltaics. As of the end of 2020, the United States had 97,275 megawatts (MW) of installed photovoltaic and concentrated solar power capacity combined. In 2018, utility scale solar power generated 66.6 terawatt-hours (TWh), 1.66% of total U.S. electricity. During the same time period total solar generation, including estimated small scale photovoltaic generation, was 96.1 TWh, 2.30% of total U.S. electricity. In terms of total cumulative installed capacity, by year end 2017 the United States ranked 2nd in the world behind China. In 2016, 39% of all new electricity generation capacity in the country came from solar, more than any other source and ahead of natural gas (29%). By 2015, solar employment had overtaken oil and gas as well as coal employment in the United States. In 2016, more than 260,000 Americans were employed in the solar industry.
Mandatory renewable energy targets are part of government legislated schemes which require electricity retailers to source specific proportions of total electricity sales from renewable energy sources according to a fixed time frame. The purpose of these schemes is to promote renewable energy and reduce dependency on fossil fuels. If this results in an additional cost of electricity, the additional cost is distributed across most customers by increases in other tariffs. The cost of this measure is therefore not funded by government budgets, except for costs of establishing and monitoring the scheme and any audit and enforcement actions. As the cost of renewable energy has become cheaper than other sources, meeting and exceeding a renewable energy target will also reduce the cost of electricity to consumers.

China's electric power industry is the world's largest electricity producer, passing the United States in 2011 after rapid growth since the early 1990s. In 2019, China produced more electricity than the next three countries—U.S., India, and Russia—combined.

Norway is a heavy producer of renewable energy because of hydropower. Over 99% of the electricity production in mainland Norway is from 31 GW hydropower plants. The average hydropower is 133 TWh/year. There is also a large potential in wind power, offshore wind power and wave power, as well as production of bio-energy from wood. Norway has limited resources in solar energy, but is one of the world's largest producers of solar grade silicon and silicon solar cells.

The Boardman Coal Plant is a coal-fired power plant located in Boardman, Oregon. The facility had a nameplate capacity of 550 megawatts (MWs) and is owned by Portland General Electric. The plant was the only remaining coal powered plant in Oregon and received much attention from regional media due to its being the largest single source of greenhouse gas emissions in the state with environmental groups such as the Sierra Club calling for its closing.

Solar power in Oregon has been growing in recent years due to new technological improvements and a variety of regulatory actions and financial incentives enacted by the state government.

Energy production in Greece is dominated by the state owned Public Power Corporation. In 2009 DEI supplied for 85.6% of all electric energy demand in Greece, while the number fell to 77.3% in 2010. Almost half (48%) of DEI's power output is generated using lignite, a drop from the 51.6% in 2009.

Energy in Hawaii is a mixture of fossil fuel and renewable resources. It is complicated by the state's isolated location and lack of fossil fuel resources. The state relies heavily on imports of petroleum and coal for power. Renewable energy production is increasing. Hawaii has the highest share of petroleum use in the United States, with about 62% of electricity coming from oil in 2017. As of 2016, 26.6% of electricity was from renewable sources, including solar, wind, hydro and geothermal.
Energy in California is a major area of the economy of California. California is the state with the largest population and the largest economy in the United States. However, it is second in energy consumption after Texas. As of 2018, per capita consumption was the fourth-lowest in the United States partially because of the mild climate and energy efficiency programs.
Each year, about 300 terawatt-hours (TWh) of electricity is used in Turkey—a fifth of the energy used and about 3 kilowatt-hours (kWh) per person per day. The carbon intensity of generation during the 2010s was about 400 grams of CO2 per kWh (gCO2/kWh), slightly less than the global average. As there is almost 100 GW capacity, far more could be generated, but only a tiny proportion is exported; consumption is forecast to increase, and there are plans to increase exports during the 2020s.
