
As of the first quarter of 2023, Washington State has 604 MW of solar power electricity generation. This is an increase from about 300 MW in 2021 and 27 MW in 2013.

Solar power in Louisiana is ranked 34th for installed solar PV capacity as of 2017 by the Solar Energy Industry Association. The state's "solar friendliness" according to Solar Power Rocks has fallen to 50th place for 2018 as the state credit program ends and full 1:1 retail net metering is being phased out. Taxpayers still benefit from federal incentive programs such as the 30 percent tax credit, which applies to business and residential solar photovoltaic and thermal energy systems of any size.

Solar power in South Carolina is rapidly becoming competitive with grid electricity, due to the decrease in cost and the eight-year extension to the 30% federal tax credit, which can be used to install any size system. South Carolina offers a 25% tax credit, meaning that 55% of the cost is covered through tax credits.

Solar power in Kentucky has been growing in recent years due to new technological improvements and a variety of regulatory actions and financial incentives, particularly a 30% federal tax credit, available through 2016, for any size project. Kentucky could generate 10% of all of the electricity used in the United States from land cleared from coal mining in the state. Covering just one-fifth with photovoltaics would supply all of the state's electricity.

Solar power in Wyoming has the potential to generate 72 million MWh/yr. Wyoming used 12 million MWh in 1999. Net metering is available to all consumers generating up to 25 kW. The state has an installed capacity of 146 MW as of 2022.
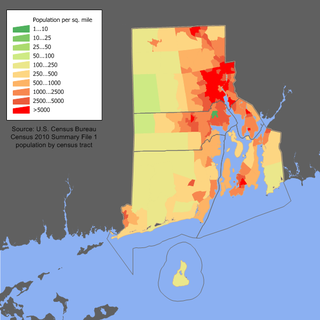
Solar power in Rhode Island has become economical due to new technological improvements and a variety of regulatory actions and financial incentives, particularly a 30% federal tax credit, available through 2016, for any size project. A typical residential installation could pay for itself in utility bill savings in 14 years, and generate a profit for the remainder of its 25 year life. Larger systems, from 10 kW to 5 MW, receive a feed-in tariff of up to 33.45¢/kWh.

Solar power in Indiana has been growing in recent years due to new technological improvements and a variety of regulatory actions and financial incentives, particularly a 30% federal tax credit for any size project.

Solar power in Kansas has been growing in recent years due to new technological improvements and a variety of regulatory actions and financial incentives.

Solar power in Alaska has been primarily used in remote locations, such as the Nenana Teen Center near Fairbanks, where long summer days provide most of the electricity generated. In 2015, Alaska ranked 45th in installed solar among U.S. states. Rooftop solar panels could provide 23% of all electricity used in Alaska. Net metering is available for PV systems up to 25 kW but is limited to 1.5% of average demand. IREC best practices, based on experience, recommends no limits to net metering, individual or aggregate, and perpetual roll over of kWh credits.
Solar power in West Virginia on rooftops can provide 23% of all electricity used in West Virginia from 6,300 MW of solar panels, but West Virginia will be the last state in the United States to reach grid parity - the point where solar panels are cheaper than grid electricity - without incentives, due to the low cost of electricity - about $0.062/kWh. The point where grid parity is reached is a product of the average insolation and the average cost of electricity. At $0.062/kWh and 4.3 sun-hours/day, solar panels would need to come down to ~$1,850/kW installed to achieve grid parity. The first state in the US to achieve grid parity was Hawaii. Solar power's favorable carbon footprint compared to fossil fuels is a major motivation for expanding renewable energy in the state, especially when compared to coal to generate electrical power.
Solar power in North Dakota has been a little-used resource. The state ranks last on installed solar power in the United States, with .47 MW of installed capacity. Solar on rooftops can provide 24.6% of all electricity used in North Dakota from 3,300 MW of solar panels. The most cost effective application for solar panels is for pumping water at remote wells where solar panels can be installed for $800 vs. running power lines for $15,000/mile.

Solar power in South Dakota has high potential but little practical application. The state ranked 50th among U.S. states in installed solar polar in 2015 with no utility-scale or large commercial systems. Photovoltaic panels on rooftops can provide 38.7% of all electricity used in South Dakota using 3,800 MW of solar panels. The state is ranked 14th in the country in solar power potential, and 4th in wind potential.

Mississippi has substantial potential for solar power, though it remains an underutilized generation method. The rate of installations has increased in recent years, reaching 438 MW of installed capacity in early 2023, ranking 36th among the states. Rooftop photovoltaics could provide 31.2% of all electricity used in Mississippi from 11,700 MW if solar panels were installed on every available roof.
Solar power in Maine on rooftops, utilizing 6,300 megawatts (MW) of solar panels, can provide 60% of the electricity used in Maine according to a 2016 U.S. Department of Energy study. Maine and Vermont are tied for the second highest rooftop solar potential in the country, only behind the state of California. A 2020 estimate suggests that a typical 5.6 kilowatt (kW) residential system will pay for itself in 6-7 years and generate a profit of $45,000 over the rest of its 25-year life from the tax credits and utility savings.

Solar power in Oklahoma can provide 44.1% of all electricity used in Oklahoma from 19,300 MW of rooftop solar panels. This scenario is extremely unlikely though because the cost of electricity in Oklahoma is among the lowest in the nation.
Solar power in Illinois has been increasing, as the cost of photovoltaics has decreased. As of the end of 2020, Illinois had 465 megawatts (MW) of installed photovoltaic and concentrated solar power capacity combined employing over 5,200 jobs. Illinois adopted a net metering rule which allows customers generating up to 40 kW to use net metering, with the kilowatt hour surplus rolled over each month, and lost at the end of either April or October, as selected by the customer. In 2011, the limit was raised to 2 MW, but is not net metering, as the term is commonly known, as it uses two meters for systems larger than 40 kW.

Solar power in Maryland is supported by the state's legislation regarding the Renewable Portfolio Standard and Solar Renewable Energy Credit (SREC) program. The target for renewable energy as of 2017 is 20% by 2020, including 2% from solar power.

Solar power in Idaho comprised 550 MW in 2019. A 2016 report by the National Renewable Energy Laboratory estimated that rooftops alone have the potential to host 4,700 MW of solar panels, and thus provide 26.4% of all electricity used in Idaho. A large increase in the state's solar generating capacity began starting year 2015 when 461 MW of solar power was contracted to be built in Idaho.

Solar power in New Hampshire provides a small percentage of the state's electricity. State renewable requirements and declining prices have led to some installations. Photovoltaics on rooftops can provide 53.4% of all electricity used in New Hampshire, from 5,300 MW of solar panels, and 72% of the electricity used in Concord, New Hampshire. A 2016 estimate suggests that a typical 5 kW system costing $25,000 before credits and utility savings will pay for itself in 9 years, and generate a profit of $34,196 over the rest of its 25-year life. A loan or lease provides a net savings each year, including the first year. New Hampshire has a rebate program which pays $0.75/W for residential systems up to 5 kW, for up to 50% of the system cost, up to $3,750. However, New Hampshire's solar installation lagged behind nearby states such as Vermont and New York, which in 2013 had 10 times and 25 times more solar, respectively.

Solar power in Wisconsin In 2026, Wisconsin rooftops can accommodate approximately 37 GWs of solar capacity and produce 44,183 GWh of electricity, nearly 70% of the statewide generation in 2019. Net metering is available for systems up to at least 20 kW, and excess generation is credited at retail rate to customers next bill. Some utilities allow net metering up to 100 kW. For Xcel customers, kilowatt credits are rolled over monthly and are reconciled annually at avoided cost. Best practices recommend no limits, either individually or aggregate, and perpetual roll over of kilowatt credits.


