The Hoover Dam, when completed in 1936, was both the world's largest electric-power generating station and the world's largest concrete structure.Hoover Dam power station
Hydroelectricity is, as of 2019, the second-largest renewable source of energy in both generation and nominal capacity (behind wind power) in the United States.[1] In 2021, hydroelectric power produced 31.5% of the total renewable electricity, and 6.3% of the total U.S. electricity.[2]
According to the International Hydropower Association, the United States is the 3rd largest producer of hydroelectric power in the world in 2021 after Brazil and China.[3] Total installed capacity for 2020 was 102,8 GW. The installed capacity was 80 GW in 2015. The amount of hydroelectric power generated is strongly affected by changes in precipitation and surface runoff.[4]
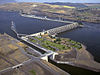
Hydroelectric stations exist in at least 34 US states. The largest concentration of hydroelectric generation in the US is in the Columbia River basin, which in 2012 was the source of 44% of the nation's hydroelectricity.[5] Hydroelectricity projects such as Hoover Dam, Grand Coulee Dam, and the Tennessee Valley Authority have become iconic large construction projects.
Of note, however, is that California does not consider power generated from large hydroelectric facilities (facilities greater than 30 megawatts) to meet its strictest definition of "renewable", due to concerns over the environmental impact of large hydroelectric projects. As such, electricity generated from large hydroelectric facilities does not count toward California's strict Renewable Portfolio Standards, even though other states recognize that water is a renewable resource in the hydrological cycle. Roughly about 10 to 15 percent of California's energy generation is from large hydroelectric generation that is not RPS-eligible.[6]
US hydropower generated 1949-2008 (blue), and hydropower as percent of total US electricity (red).Monthly hydroelectric power generation in the US, 2008–2012. Hydroelectric power varies with seasonal stream flows.
The earliest hydroelectric power generation in the U.S. was utilized for lighting and employed the better understood direct current (DC) system to provide the electrical flow. It did not flow far however, with ten miles being the system's limit; solving electricity's transmission problems would come later and be the greatest incentive to the new hydroelectric water-power developments.[7]
The first DC powerhouse was in Grand Rapids, Michigan, where the water turbine at the Wolverine Chair factory was attached to a dynamo using a mechanical belt drive to illuminate sixteen street lights.[8][9] This occurred in 1880, the same year Thomas Edison produced the long-lasting incandescent filament light bulb, which was a safety and convenience improvement over existing candles, whale oil lamps and kerosene lamps inside buildings. In 1881, also using DC for lighting at Niagara Falls, Jacob F. Schoellkopf diverted part of the output from his waterwheel-powered flour mills to drive one of Charles Brush's improved generators to provide nighttime illumination for the tourists. Previously the attraction had been illuminated by burning bright calcium flares but arc-lights proved a better and cheaper alternative. In 1882, the world's first commercial central DC hydroelectric power plant provided power for a paper mill in Appleton, Wisconsin;[10] just months later the first investor-owned electric utility, Edison Illuminating Company, completed the first fossil fueled electrical power plant in New York City, to compete with hydroelectric power close to an area of high demand. By 1886, between 40 and 50 hydroelectric stations were operating in the United States and in Canada, and by 1888 about 200 electric companies relied on hydropower for at least part of their generation.[9]
Recognizing that the great hydroelectric potential of the Falls exceeded the local demand for electricity, a large power company was established nonetheless at the prime location for development; it awaited the prospect of an effective long-distance power transmission system. Westinghouse Electric won the competition, developing their plans around an alternating current system. The station was completed in 1895 and in 1896, electricity transmission 20 miles away to Buffalo, New York began. This event also began the rise to dominance of the AC system over Thomas Edison's direct current methods. Multiple permanent hydropower stations still exist on both the American and Canadian sides of the Falls, including the Robert Moses Niagara Power Plant, the third largest in the United States.
The need to provide rural development in the early 20th century was often coupled to the availability of electric power and led to large-scale projects like the Tennessee Valley Authority which created numerous dams and, sometimes controversially, flooded large areas. In the 1930s, the need for power in the Southwest led to the building of the largest concrete construction in the world at that time, the Hoover Dam. The Grand Coulee Dam was both a power and irrigation project of the 1930s that was expanded for military industrial reasons during World War II which also saw other dams such as the TVA's Fontana Dam built.
Dam building peaked in the 1960s and few dams were built in the 1970s. The growing awareness of environmental issues with dams saw the removal of some older and smaller dams and the installation of fish ladders at others. The enormous Rampart Dam was canceled in 1967 due to environmental and economic concerns. Instead of new dams, repowering old stations has increased the capacity of several facilities. For instance, Hoover Dam replaced its generators between 1986 and 1993. The need to alter downstream waterflow for ecological reasons (eliminating invasive species, sedimentation, etc.) has led to regulated seasonal drawdowns at some dams, changing the availability of water for power generation. Droughts and increased agricultural use of water can also lead to generation limits.
According to a United States Department of Energy report,[11] there exists over 12,000 MW of potential hydroelectricity capacity in the US existing 80,000 unpowered dams. Harnessing the currently unpowered dams could generate 45 TWhr/yr, equivalent to 16 percent of 2008 hydroelectricity generation.
According to a 2022 study, hydroelectric dams constructed prior to 1950 spurred short-run local economic growth due to cheaper power for localities. After 1950, the impact of hydropower dams on localities was more muted, most likely due to innovations such as high-tension transmission lines which dispersed the energy produced by dams to larger areas.[12]
Pumped storage
Another application of hydroelectricity is Pumped-storage hydroelectricity which does not create a net gain in power but enables peak demand balancing. Water is pumped from a lower elevation source into a higher one and only released through generators when electric demand is high. In 2009 the United States had 21.5 GW of pumped storage generating capacity, accounting for 2.5% of baseload generating capacity.[13] This increased to a total of 22,878 MW in 2019 and 22,894 MW in 2020.[14]Bath County Pumped Storage Station is the largest such facility in the world. Other stations of this type include Raccoon Mountain Pumped-Storage Plant, Bear Swamp Hydroelectric Power Station and Ludington Pumped Storage Power Plant on Lake Michigan and previously the largest in the world.
Tidal power
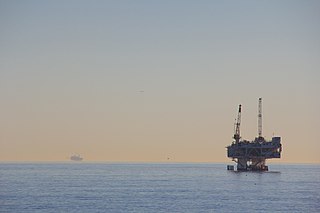
No significant tidal power plants exist in the United States. A project was proposed and run by the Snohomish County PUD in Washington but was ended when trouble was encountered obtaining enough funding.[15]
Small hydro is the development of hydroelectric power on a scale suitable for local community and industry, or to contribute to distributed generation in a regional electricity grid. Exact definitions vary, but a "small hydro" project is less than 50 megawatts (MW), and can be further subdivide by scale into "mini" (<1MW), "micro" (<100 kW), "pico" (<10 kW). In contrast many hydroelectric projects are of enormous size, such as the generating plant at the Three Gorges Dam at 22,500 megawatts or the vast multiple projects of the Tennessee Valley Authority.
Pumped-storage hydroelectricity (PSH), or pumped hydroelectric energy storage (PHES), is a type of hydroelectric energy storage used by electric power systems for load balancing. The method stores energy in the form of gravitational potential energy of water, pumped from a lower elevation reservoir to a higher elevation. Low-cost surplus off-peak electric power is typically used to run the pumps. During periods of high electrical demand, the stored water is released through turbines to produce electric power. Although the losses of the pumping process make the plant a net consumer of energy overall, the system increases revenue by selling more electricity during periods of peak demand, when electricity prices are highest. If the upper lake collects significant rainfall or is fed by a river then the plant may be a net energy producer in the manner of a traditional hydroelectric plant.
Hydroelectricity, or hydroelectric power, is electricity generated from hydropower. Hydropower supplies one sixth of the world's electricity, almost 4,500 TWh in 2020, which is more than all other renewable sources combined and also more than nuclear power. Hydropower can provide large amounts of low-carbon electricity on demand, making it a key element for creating secure and clean electricity supply systems. A hydroelectric power station that has a dam and reservoir is a flexible source, since the amount of electricity produced can be increased or decreased in seconds or minutes in response to varying electricity demand. Once a hydroelectric complex is constructed, it produces no direct waste, and almost always emits considerably less greenhouse gas than fossil fuel-powered energy plants. However, when constructed in lowland rainforest areas, where part of the forest is inundated, substantial amounts of greenhouse gases may be emitted.
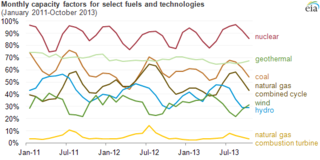
The net capacity factor is the unitless ratio of actual electrical energy output over a given period of time to the theoretical maximum electrical energy output over that period. The theoretical maximum energy output of a given installation is defined as that due to its continuous operation at full nameplate capacity over the relevant period. The capacity factor can be calculated for any electricity producing installation, such as a fuel consuming power plant or one using renewable energy, such as wind, the sun or hydro-electric installations. The average capacity factor can also be defined for any class of such installations, and can be used to compare different types of electricity production.
There is a large array of stakeholders that provide services through electricity generation, transmission, distribution and marketing for industrial, commercial, public and residential customers in the United States. It also includes many public institutions that regulate the sector. In 1996, there were 3,195 electric utilities in the United States, of which fewer than 1,000 were engaged in power generation. This leaves a large number of mostly smaller utilities engaged only in power distribution. There were also 65 power marketers. Of all utilities, 2,020 were publicly owned, 932 were rural electric cooperatives, and 243 were investor-owned utilities. The electricity transmission network is controlled by Independent System Operators or Regional Transmission Organizations, which are not-for-profit organizations that are obliged to provide indiscriminate access to various suppliers to promote competition.
India is 5th globally for installed hydroelectric power capacity. As of 31 March 2020, India's installed utility-scale hydroelectric capacity was 46,000 MW, or 12.3% of its total utility power generation capacity. Additional smaller hydroelectric power units with a total capacity of 4,683 MW have been installed. India's hydroelectric power potential is estimated at 148,700 MW at 60% load factor. In the fiscal year 2019–20, the total hydroelectric power generated in India was 156 TWh with an average capacity factor of 38.71%.
As of 2018, hydroelectric power stations in the United Kingdom accounted for 1.87GW of installed electrical generating capacity, being 2.2% of the UK's total generating capacity and 4.2% of UK's renewable energy generating capacity. This includes four conventional hydroelectric power stations and run-of-river schemes for which annual electricity production is approximately 5,000GWh, being about 1.3% of the UK's total electricity production. There are also four pumped-storage hydroelectric power stations providing a further 2.8GW of installed electrical generating capacity, and contributing up to 4,075GWh of peak demand electricity annually.
Energy in California is a major area of the economy of California. California is the state with the largest population and the largest economy in the United States. It is second in energy consumption after Texas. As of 2018, per capita consumption was the fourth-lowest in the United States partially because of the mild climate and energy efficiency programs.
↑ Engr. W. E. Herring, U. S. Forest Service, Applications of Water Power. Included in the Preliminary Report of the Inland Waterways Commission, submitted to Congress by Theodore Roosevelt, February 26, 1908. "The application of great water powers to the industrial wants of distant cities is less than ten years old and is still in its infancy, yet in this short space of time stations supplying a large number of cities in the United States with a combined capacity of hundreds of thousands of horsepower have been installed. To reach these industrial centers the water power is electrically transmitted, and in many cases the distance is over 100 miles. This method of utilizing water power has been made possible only by long distance transmission. Fifteen years ago 10 miles was the limit to which electrical power could be transmitted, but at the present time 150 miles is very common and in one case a line of 200 miles is in use. This fact has been the greatest incentive to such water-power developments."
↑ Hydroelectric Power "The first commercial hydroelectric power station was built in 1882 on the Fox River in Appleton, Wisconsin, in order to provide 12.5 kilowatts of power to light two paper mills and a residence. Paper manufacturer H. F. Rogers developed the station after seeing Thomas Edison's plans for an electricity power station in New York."
This page is based on this Wikipedia article Text is available under the CC BY-SA 4.0 license; additional terms may apply. Images, videos and audio are available under their respective licenses.