Wind power in New York

Last updated
USA New York location map.svg
Green pog.svg
Wethersfield
Green pog.svg
Madison
Green pog.svg
Steel Winds
Green pog.svg
Fenner
Green pog.svg
Clinton
Green pog.svg
Hardscrabble
Black pog.svg
Black Oak
Wind power projects in New York
  Green pog.svg Operating
  Orange pog.svg Under construction
  Purple pog.svg Proposed
  Black pog.svg Canceled or decommissioned

New York has 2,192 MW of installed wind power capacity as of 2022. [1] Most of New York's wind power is located in upstate New York as onshore wind farms. New York has set a goal of developing 9,000 MW of offshore installed wind power capacity by 2035 that will power an estimated 6 million homes. As of October 2022, New York has five offshore wind farms in development with approximately 4,300 MW installed capacity. [2]

Contents

Wind farms

Cassadaga Wind Farm CassadagaWindFarm.jpg
Cassadaga Wind Farm
Arkwright Summit Wind Farm ArkwrightSummit From Cassadaga.jpg
Arkwright Summit Wind Farm

The first wind farms in New York came online in 2000. They were relatively small projects. Madison Wind Farm, with a nameplate generating capacity of 11.55 MW, located in Madison County, was the first to commence operations. Also that year, the 6.6 MW Wethersfield Wind Farm, located in Wyoming County, came on line. The following year, the 30 MW Fenner Wind Farm, also in Madison County, commenced operations.

Five years passed before Maple Ridge Wind Farm, the largest wind farm in the state of New York, located in Lewis County, with 195  Vestas model V82 1.65  megawatt (MW) wind turbines, commenced operations. [3] [4] Collectively, the turbines have a rated or nameplate capacity of 320 MW. [5] Maple Ridge Wind Farm became fully operational in January 2006.

The Bliss Windpark in Wyoming County opened in May 2008 with a capacity of 100.5 megawatts. Also, in 2008, the 100.5 MW Clinton Windpark, located in Clinton County, commenced operations. In February 2009, three other large wind farms — the Altona, Chateaugay, and Wethersfield Windparks — were completed in Upstate New York in Clinton, Franklin, and Wyoming Counties, respectively. The projects have an installed capacity of 97.5, 106.5, and 124 MW respectively. All four use General Electric 1.5SLE wind turbines. [6] The 112.5 MW Sheldon Wind Project in Wyoming County also came on line in 2009. In 2010, the Hardscrabble Wind Farm located in Herkimer County was constructed in the Towns of Farfield, Norway, and Little Falls, NY. The wind farm has 37 Gamesa G90 2.0 MW wind turbines and came online in 2011. The project generates 74 Megawatts of power and is owned by Iberdrola Renewables. In 2012, the 215 MW Marble River Wind Farm, located in Clinton County, commenced operations. Wind farms completed in 2018 include Arkwright Summit Wind Farm and Copenhagen Wind Farm. [7]

The capacity factor of wind farms in New York is about 30 percent. However, the effective capacity — the fraction of rated power generated during summer afternoons, the period of peak demand — is estimated to be 10 percent for the whole state, except for Long Island where about 40% is forecast. [8]

Wind power development

Wind is a very powerful element in society, and is able to provide energy without emitting greenhouse gases. Therefore, able to make a valid contribution to electricity demands. More than a quarter of power of the athletic complex at Union College of Schenectady County is supported by the endorsement of tall wind turbines. In 2014, energy projects accounted for more than 1,800 MW. Which in return estimated to be around 2.6 of the electric power available from "generation facilities in New York" and able to provide power for a million residents. While two power projects are being constructed in the state of New York, there is also a project under "active review." Wind energy development itself has striven towards achieving the goals of New York's renewable energy.

This series of projects is just a start for the 15th windiest state in the Nation, New York. The National Renewable Energy Laboratory has confirmed that the wind resource is able to provide at least half of the needs of the states electricity.

A NYISO study conducted in 2010, Growing Wind: Final Report of the NYISO 2010 Wind Generation Study (Sept. 2010), found that the New York power system will allow for the integration of up to 8,000 MW of wind generation with no adverse reliability impacts. At higher levels of wind generation, due to increased variability, the analysis determined that for every 1,000 MW increase between the 4,250 MW and 8,000 MW wind penetration level, the average regulation requirement increases approximately 9 percent. Further, given existing transmission constraints, at the 6,000 MW scenario modeled, 8.8% of the energy production in three areas of upstate New York (Zones C - Central, D - North, and E - Mohawk) would be "bottled" or undeliverable. With upgrades, the amount of bottled wind energy could be reduced to less than 2 percent. A similar bottling pattern was found in the 8,000 MW model. Offshore wind energy, as modeled, is fully deliverable. [9]

In January 2015, Sims Municipal Recycling (a division of Sims Metal Management) inaugurated the New York City's only commercial-scale wind turbine at its recycling center at the South Brooklyn Marine Terminal. Built by Northern Power Systems at the cost of about $750,000, the 160 ft (49 m) tall turbine has the capacity to produce 100 kilowatts, or 4% of the center's power needs. [10] [11]

Offshore wind power

In 2009, utilities in the state such as the New York Power Authority and Long Island Power Authority were exploring the possibility of large-scale offshore facilities, either in the ocean [12] or in the Great Lakes. [13] The New York Power Authority cancelled, in 2011, the Great Lakes Offshore Wind (GLOW) project. [14]

On September 8, 2011, the New York Power Authority, Long Island Power Authority, and Con Edison (the Offshore Wind Collaborative) filed a request with the US Department of the Interior, Bureau of Ocean Energy Management (BOEM) to issue a commercial lease on the outer continental shelf to the New York Power Authority for the development of the Long Island - New York City Offshore Wind Project. This project would be located in the Atlantic Ocean off Nassau County, approximately 13 nautical miles off Rockaway Peninsula, in a long 65,000-acre wedge-shaped area between shipping channels, directionally aligned southwest of Rockaway Peninsula. The project as now configured consists of 97 offshore turbines, with a total nameplate generating capacity of 350 MW. With 194 turbines, generating capacity could be doubled to 700 MW. Given the lengthy permitting process, the Collaborative's proposed project would not be operational until 2018 at the earliest. On January 4, 2013, BOEM issued a Request for Interest (Docket ID: BOEM-2012-0083) to determine whether other parties were interested in developing the same area. In addition to the Collaborative's response, BOEM received letters of interest in a commercial lease for this area from Fishermen's Energy LLC and Energy Management, Inc. [15]

Another offshore wind energy project that would supply electricity to New York is Deepwater ONE. On September 12, 2013, BOEM awarded two commercial offshore wind energy leases, OCS-A-0486 and OCS-A-0487, to Deepwater Wind New England LLC for development of a regional offshore wind energy project. [16] Deepwater ONE (formerly Deepwater Wind Energy Center) would be located in the Atlantic Ocean on 256 square miles on the outer continental shelf, approximately 30 miles east of Montauk, New York, and 15 miles east of Martha's Vineyard, Massachusetts. The project would consist of 150 to 200 turbines with a total nameplate generating capacity of 900 to 1,200 MW. It includes a 98-mile, 600 MW submarine transmission line, a new regional HVDC transmission system, and a New York-Long Island interconnector to link the electrical supply system in New England and Long Island. [17]

In October 2023, New York awarded three additional offshore wind projects with 4,032 MW capacity.

List of NYSERDA Contracted Wind Projects in New York State [18] [19]
ProjectDeveloper Capacity(MW)Projected Completion
Beacon WindEquinor Wind US LLC1,2302028
Empire Wind 2Equinor Wind US LLC1,2602027
Empire Wind 1 Equinor Wind US LLC8162026
Sunrise WindSunrise Wind LLC9242025
South Fork Wind Farm Ørsted and Eversource1302023
Attentive Energy OneTotalEnergies, Rise Light & Power and Corio Generation1,4042030
Community Offshore WindRWE Offshore Renewables and National Grid Ventures1,314 MW2030
Excelsior WindVineyard Offshore (Copenhagen Infrastructure Partners)1,314 MW2030

Renewable energy incentives

Renewable Portfolio Standard

The New York State Public Service Commission adopted a Renewable Portfolio Standard (RPS) policy in 2004, calling for an increase in renewable energy used in the state from the then-current level of 19.3 percent (largely attributable to legacy hydroelectric power projects) to at least 25 percent by the end of 2013. In 2010, the Commission raised the standard to 30 percent by the end of 2015, and extended the program through 2015. With the RPS program due to sunset in 2015, the Commission has undertaken a program review. Unlike most states with an RPS, New York follows a central procurement model, with the New York State Energy Research and Development Authority (NYSERDA) responsible for meeting the majority of the RPS goals. NYSERDA obtains the bulk of the RPS Attributes (including any and all reductions in harmful pollutants and emissions such as carbon dioxide and oxides of sulfur and nitrogen) through a "Main Tier" competitive procurement of utility-scale renewable resources. A "Customer-Sited Tier," smaller, behind-the-meter resources provided by residential, commercial, institutional, and governmental projects, complements the Main Tier. Voluntary markets, state agency purchases, and Long Island Power Authority purchases make up the balance. [20]

Wind power is the predominant generating technology in the Main Tier, with 21 wind farms generating or expected to generate 1,696 MW of new renewable energy by the end of 2014. As of the end of 2013, 18 wind farms funded through the Main Tier were generating 1,657 MW of new renewable energy. [21]

Financial incentives

The New York State Energy Research and Development Authority (NYSERDA), through its On-Site Wind Turbine Incentive Program (which began in 2007), is making $13.8 million available in incentives to encourage the installation of residential, commercial, institutional, and governmental end-use wind energy systems. The program runs from December 1, 2012 through December 31, 2015, with completed applications accepted through September 30, 2015. NYSERDA will pay up to 50 percent of the total installed cost of the wind energy system to eligible installers who install new approved, grid-connected systems using qualified equipment in accordance with eligibility requirements. The installer must pass the entire incentive through to the customer. The maximum incentive is $1 million per site or customer, and the maximum turbine size is 2 MW (2,000 kW). [22]

Procedural reforms

Opposition to utility-scale wind turbines in Chautauqua County NY Wind opposition.jpg
Opposition to utility-scale wind turbines in Chautauqua County

With a strong tradition of home rule and, for many year, no state requirements or guidelines for locating facilities, the siting of large facilities in New York state has generated some controversy, along with myriad, diverse municipal efforts to zone or ban wind farms. Such conditions helped to produce in summer 2009 a Code of Conduct [23] promulgated by the state's Attorney General Andrew Cuomo and embraced by wind developers responsible for a majority of the state's facilities.

In a significant reform aimed at encouraging investment in clean energy technology, Governor Andrew Cuomo on August 4, 2011, signed into law the Power New York Act of 2011, Chapter 388 of the Laws of 2011, enacting Article 10 of the Public Service Law, establishing a unified siting review process for major electric generating facilities; that is, facilities with a generating capacity of 25 MW or more. The New York Department of Public Service and the New York Department of Environmental Conservation adopted implementing regulations on July 17, 2012: Chapter X Certification of Major Electric Generating Facilities, 16 NYCRR Part 1000 and Analyzing Environmental Justice Issues in Siting of Major Electric Generating Facilities, 6 NYCRR Part 487. After July 17, 2012, all applicants for permits to construct major electric generating facilities must follow Article 10. In addition, applicants who had applied for permits or licenses before that date, along with applicants for permits or licenses for certain other types of electric generating facilities excluded from Article 10, may elect to follow Article 10.

Article 10 creates an administrative agency lodged within the Department of Public Service, the Board on Electric Generation Siting and the Environment, to conduct the reviews and make final administrative siting decisions. The Board has seven members; five are agency heads (the "Permanent Board") and two are appointed on a project-specific basis (the local, ad hoc public members). The new law provides a unified review process for the state permits, licenses, and other approvals required to site, construct, and operate a major electric generating facility. Department of Environmental Conservation review of permit applications under federally delegated or approved Clean Air Act, Clean Water Act, and Resource Conservation and Recovery Act programs is coordinated with, and conducted through, the Article 10 review. The Department of State's coastal zone consistency determination is also coordinated with the Article 10 review. Federal permitting and licensing reviews may be coordinated with the Article 10 review. Article 10 provides for consideration of local laws, and Board decisions must provide reasons for deviation from local substantive requirements. Article 10 seeks to promote early and effective public participation in the siting process, facilitating communication between the applicant and interested persons, to minimize later delays and reduce the likelihood of litigation challenging siting decisions. It provides numerous public participation opportunities, including the distribution of "intervenor funds" derived from application fees to enable municipalities and local parties to hire technical experts and lawyers to assist them in participating in the proceeding. [24]

Further, an expansion of the state's net metering laws in 2008 may help to grow the market for small-scale residential, agricultural, or commercial installations.

Installed capacity

New York Wind Generation by Year
Wind power in New York
Thousand Megawatt-hours [25] [26] [27]
New York wind power capacity by year (MW) [28]
YearAmountChange % Change
1999000%
200018.218.2
200148.230
200248.50.3
200348.500%
200448.500%
2005185.5136.5283%
2006370.3185.3100%
2007424.854.515%
2008831.840796%
20091,274.3442.553%
20101,274.300%
20111,403128.710%
20121,63823517%
20131,722845%
20141,748262%
20151,74915%
20161,82778
20171,82921%
20181,9871588%
20191,98700%
20201,987

Wind generation

2013 Wind power capacity density by state Wind power capacity density by state 2013.svg
2013 Wind power capacity density by state
New York Wind Generation (GWh, Million kWh)
YearTotalJanFebMarAprMayJunJulAugSepOctNovDec
200123212222222222
2002825555566655524
200341334333333445
20041181311131110765691215
2005102991186555881513
20066565961545542334638476853100
20078328493107874550445155657378
20081,2511098588831101578862689499208
20092,26616320817629822296153128134184202302
20102,595230206238236196173157157235255257255
20112,831178326312325187173146157151242330304
20122,992394308321274168206123149184271242352
20133,539422290312404280207145180205299445350
20143,968456368399443288189236185239362472331
20153,977488343440395318220184195189390415401
20163,940480437388257236278219214195327371538
20174,236368384427418360327249218250409479347
20183,998451427305360323244233241260381389384
20194,457465414471449301328242255278393372489
20204,523385391472451318242273247352376563453
20214,389315378535382325343233239341366415517
20224,788417485507462355327299239268406510513
20231,489368568553

  Teal background indicates the largest wind generation month for the year.

  Green background indicates the largest wind generation month to date.

Source: [25]

See also

Related Research Articles

<span class="mw-page-title-main">Wind power in the United Kingdom</span>

The United Kingdom is the best location for wind power in Europe and one of the best in the world. The combination of long coastline, shallow water and strong winds make offshore wind unusually effective.

<span class="mw-page-title-main">Economy of New York (state)</span>

The economy of the State of New York is reflected in its gross state product in 2022 of $2.053 trillion, ranking third in size behind the larger states of California and Texas. If New York State were an independent nation, it would rank as the 10th largest economy in the world by nominal GDP. However, in 2019, the multi-state, New York City-centered metropolitan statistical area produced a gross metropolitan product (GMP) of $US2.0 trillion, ranking first nationally by a wide margin and would also rank as the 10th largest GDP in the world.

<span class="mw-page-title-main">Wind power in the United States</span>

Wind power is a branch of the energy industry that has expanded quickly in the United States over the last several years. From January through December 2023, 425.2 terawatt-hours were generated by wind power, or 10.18% of electricity in the United States. The average wind turbine generates enough electricity in 46 minutes to power the average American home for one month. In 2019, wind power surpassed hydroelectric power as the largest renewable energy source in the U.S.

<span class="mw-page-title-main">Wind power in India</span>

Wind power generation capacity in India has significantly increased in recent years. As of 31 December 2023, the total installed wind power capacity was 44.736 gigawatts (GW), the fourth largest installed wind power capacity in the world. Wind power capacity is mainly spread across the southern, western, and northwestern states.

<span class="mw-page-title-main">Wind power in Texas</span> Electricity from wind in one U.S. state

Wind power in Texas, a portion of total energy in Texas, consists of over 150 wind farms, which together have a total nameplate capacity of over 30,000 MW. If Texas were a country, it would rank fifth in the world: The installed wind capacity in Texas exceeds installed wind capacity in all countries but China, the United States, Germany and India. Texas produces the most wind power of any U.S. state. According to the Electric Reliability Council of Texas (ERCOT), wind power accounted for at least 15.7% of the electricity generated in Texas during 2017, as wind was 17.4% of electricity generated in ERCOT, which manages 90% of Texas's power. ERCOT set a new wind output record of nearly 19.7 GW at 7:19 pm Central Standard Time on Monday, January 21, 2019.

<span class="mw-page-title-main">Wind power in California</span> Electricity from large wind farms

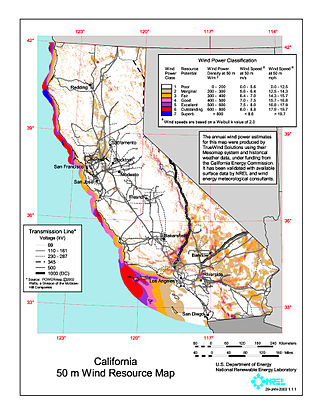
Wind power in California had initiative and early development during Governor Jerry Brown's first two terms in the late 1970s and early 1980s. The state's wind power capacity has grown by nearly 350% since 2001, when it was less than 1,700 MW. In 2016, wind energy supplied about 6.9% of California's total electricity needs, or enough to power more than 1.3 million households. Most of California's wind generation is found in the Tehachapi area of Kern County, California, with some large projects in Solano, Contra Costa and Riverside counties as well. California is among the states with the largest amount of installed wind power capacity. In recent years, California has lagged behind other states when it comes to the installation of wind power. It was ranked 4th overall for wind power electrical generation at the end of 2016 behind Texas, Iowa, and Oklahoma. As of 2019, California had 5,973 megawatts (MW) of wind power generating capacity installed.

<span class="mw-page-title-main">Wind power in Oregon</span> Electricity from wind in one U.S. state

The U.S. state of Oregon has large wind energy resources. Many projects have been completed, most of them in rural Eastern Oregon and near the Columbia River Gorge. Wind power accounted for 12.1% of the electricity generated in Oregon in 2016.

Ørsted U.S. Offshore Wind is an offshore wind energy development group that is affiliated with Ørsted, a Danish firm. It is joint headquartered in Boston, Massachusetts and Providence, Rhode Island. As of 2019, it was involved in some of the largest offshore wind farm projects in the United States.

<span class="mw-page-title-main">Wind power in Massachusetts</span> Electricity from wind in one U.S. state

The U.S. state of Massachusetts has vast wind energy resources offshore, as well as significant resources onshore. The 2016 update to the states's Clean Energy and Climate Plan had a goal of reducing 1990 baseline greenhouse gas emissions levels by 25% by 2020. Current goals include installing 3,500 megawatts (MW) of offshore wind power in the state by 2035. However, as of Q4 2021 the state had only 120 MW of wind powered electricity generating capacity, responsible for generating 0.9% of in-state electricity production. The state has awarded contracts to two offshore projects, the 800 MW Vineyard Wind project and 804 MW Mayflower Wind project. Construction began on the Vineyard Wind 1 project on November 18, 2021, after a long fight for approval. Commonwealth Wind was selected for development in 2021, but the developer has attempted to cancel the project due to increased costs. There are eight projects planned for off the southern coast of Massachusetts, though some will deliver power to Rhode Island, Connecticut, and New York.

<span class="mw-page-title-main">Wind power in Colorado</span> Electricity from wind in one U.S. state

The US state of Colorado has vast wind energy resources and the installed electricity capacity and generation from wind power in Colorado has been growing significantly in recent years. The growth has been sustained due to a combination of falling costs, continuing federal incentives, and the state's aggressive renewable portfolio standard that requires 30% of the state's electricity to come from renewable sources by 2020.

Modern United States wind energy policy coincided with the beginning of modern wind industry of the United States, which began in the early 1980s with the arrival of utility-scale wind turbines in California at the Altamont Pass wind farm. Since then, the industry has had to endure the financial uncertainties caused by a highly fluctuating tax incentive program. Because these early wind projects were fueled by investment tax credits based on installation rather than performance, they were plagued with issues of low productivity and equipment reliability. Those investment tax credits expired in 1986, which forced investors to focus on improving the reliability and efficiency of their turbines. The 1990s saw rise to a new type of tax credit, the production tax credit, which propelled technological improvements to the wind turbine even further by encouraging investors to focus on electricity output rather than installation.

Wind power in New Jersey is in the early stages of development. New Jersey has just six wind turbines, but the state has plans to develop several major offshore wind projects on the continental shelf of the Atlantic Ocean off the southern Jersey Shore. Legislation has been enacted to support the industry through economic incentives and to permit wind turbines on existing piers.

<span class="mw-page-title-main">Energy in Hawaii</span> Overview of energy resources in Hawaii, US

Energy in the U.S. state of Hawaii is produced from a mixture of fossil fuel and renewable resources. Producing energy is complicated by the state's isolated location and lack of fossil fuel resources. The state relies heavily on imports of petroleum. Hawaii has the highest share of petroleum use in the United States, with about 62% of electricity coming from oil in 2017. As of 2021 renewable energy made up 34.5% on Oahu, Maui and the island of Hawaii.

<span class="mw-page-title-main">Wind power in Hawaii</span> Electricity from wind in one U.S. state

Wind power in Hawaii is produced by the state's 132 commercial wind turbines, totaling 236 MW in capacity. In 2015, wind turbines produced 6.4% of Hawaii's electricity. In 2012, Hawaii generated 367 million kWh from wind power.

<span class="mw-page-title-main">Wind power in Rhode Island</span> Electricity from wind in one U.S. state

Wind power in Rhode Island is in the early stages of development. There are several small scale wind turbine projects in the state. As of December 2013 there were 11 turbines at 10 sites in the state. In 2014, Rhode Island had 9 MW of installed wind power capacity, which quickly rose to 75 MW in 2019.

<span class="mw-page-title-main">Wind power in Maryland</span> Electricity from wind in one U.S. state

Wind power in Maryland, which has land-based and offshore resources, is in the early stages of development. As of 2016, Maryland has 191 megawatts (MW) of wind powered electricity generating capacity, responsible for 1.4% of in-state generated electricity. Two offshore wind farm projects that will supply wind-generated power to the state are underway.

<span class="mw-page-title-main">Wind power in North Carolina</span> Electricity from wind in one U.S. state

Wind power in North Carolina is found along the coastal areas in the east and mountain regions in the western part of the state. The state has significant offshore wind resources. In 2015, small scale wind turbine projects were found throughout the state. In 2016, North Carolina's first large scale wind project, and the first in the southeastern U.S., was completed near Elizabeth City.

South Fork Wind Farm is a utility-scale offshore wind farm on the Outer Continental Shelf Offshore Rhode Island, providing energy to New York state.

Empire Wind is a proposed utility-scale offshore wind farm on the Outer Continental Shelf Offshore New York. It will be located in Bureau of Ocean Energy Management (BOEM) lease area OCS-A 0512 in the New York Bight about 15 miles (24 km) south of Jones Beach, Long Island.

References

  1. "WINDExchange: Wind Energy in New York". windexchange.energy.gov. Retrieved 2022-10-30.
  2. "2022 Solicitation". NYSERDA. Retrieved 2022-10-30.
  3. "Major US order for Vestas Wind Systems". Ministry of Foreign Affairs (Denmark). 2005-04-07. Retrieved 2008-09-07.
  4. "Maple Ridge Wind Farm". Horizon Wind Energy . Retrieved 2008-09-07.
  5. "Maple Ridge Wind Farm Landmark Project Will Quadruple New York Wind Energy Capacity". Climate Change Chronicles. April 7, 2005. Retrieved 2006-05-16.
  6. 330 MW of Wind Power Go Online in New York
  7. "U.S. Wind Turbine Database" . Retrieved 12 August 2019.
  8. "The Effects of Integrating Wind Power on Transmission System Planning, Reliability, and Operations - Report on Phase 2" (PDF). New York State Energy Research and Development Authority. March 4, 2005. p. 7.16. Retrieved 2009-05-02. Capacity factors of inland wind sites in New York are on the order of 30% of their rated capacity. Their effective capacities, however, are about 10%, due to both the seasonal and daily patterns of the wind generation being largely "out of phase" with the NYISO load patterns. The offshore site in Long Island exhibits both annual and peak period effective capacities on the order of 40%.
  9. New York Independent System Operator, Growing Wind: Final Report of the NYISO 2010 Wind Generation Study (Sept. 2010).
  10. Giambusso, David (January 15, 2015). "Recycling firm unveils city's first commercial wind turbine". CapitalNeYork. Retrieved 2015-02-22.
  11. Schlossbergian, Tatiana (January 15, 2015). "In Brooklyn, Fertile Ground for a Wind Turbine". The New York Times. Retrieved 2015-02-22.
  12. Long Island – New York City Offshore Wind Project
  13. [New York State Board on Electric Generation Siting and the Environment http://www.nypa.gov/nypawindpower/ New York Port Authority Wind Power]
  14. Press Release
  15. US Bureau of Ocean Energy Management: New York Activities
  16. US Bureau of Ocean Energy Management, Commercial Wind Leases for the Wind Energy Area Offshore Rhode Island and Massachusetts
  17. Deepwater Wind: Deepwater ONE
  18. "New York's Offshore Wind Projects". NYSERDA. Retrieved 2022-10-30.
  19. "Governor Hochul Announces Nation's Largest-Ever State Investment in Renewable Energy is Moving Forward in New York | Governor Kathy Hochul". www.governor.ny.gov. Retrieved 2023-10-24.
  20. New York State Public Service Commission, Renewable Portfolio Standard (Case 03-E-0188); New York State Energy Research and Development Authority, New York Renewable Portfolio Standard; Pace Energy and Climate Center, New York's Renewable Portfolio Standard: Where To From Here? (Pace Law School 2013).
  21. New York State Energy Research and Development Authority, New York State Renewable Portfolio Standard: Annual Performance Report Through December 31, 2013 (Final Report 2014).
  22. NYSERDA On-Site Wind Turbine Incentive Program
  23. New York Attorney General announces 17 wind developers sign new code of conduct
  24. New York State Board on Electric Generation Siting and the Environment
  25. 1 2 "Electricity Data Browser". U.S. Department of Energy. March 28, 2018. Retrieved March 28, 2018.
  26. Office of Energy Efficiency and Renewable Energy (Mar 12, 2010). "Installed Wind Capacity by State". United States Department of Energy . Retrieved Mar 12, 2010.
  27. Wind Energy in New York
  28. WINDExchange: U.S. Installed and Potential Wind Power Capacity and Generation