Wind power in Illinois

Last updated

Mendota Hills Wind Farm in northern Illinois Barn wind turbines 0504.jpg
Mendota Hills Wind Farm in northern Illinois

Wind power in Illinois provided nearly 10% of the state's generated electrical power in 2020 powering 1,231,900 homes. [1] At the end of 2020, Illinois had 6,300 megawatts (MW) of wind power installed, ranking fifth among states for installed wind turbine capacity. [2] An additional 1,100 MW of wind power was under construction across the state at the end of 2020.

Contents

The vast majority of wind-generated electricity in Illinois is distributed via Midcontinent Independent System Operator, which services Illinois outside of northern Illinois—as opposed to PJM Interconnection, which distributes electricity in the Chicago metropolitan area. [3]

Overview

Wind power has been supported by a renewable portfolio standard, passed in 2007, and strengthened in 2009, which requires 10% renewable energy from electric companies by 2010 and 25% by 2025. [4] For 2013, in-state renewable generation was just 5.1% of Illinois' total generation. [5] Additional renewably generated electricity is imported from other states. [6] Illinois uses a large amount of electricity, and the state's mandate was enacted when only a very small percentage of its electricity was renewably generated.

Illinois has the potential for installing up to an estimated 249,882 MW of wind generation capacity at a hub height of 80 meters operating at 30% gross capacity factor. [7] [8] That amount is lower with higher capacity factors and is higher with 100 meter hub heights. [8]

The first wind farm in Illinois opened in 2003 and by 2009, it had over 1800 MW installed statewide with thousands of MW more in the planning stages. [9] The largest wind farm in the state is the 300 MW Cayuga Ridge installation, while another seven windfarms each exceeded  MW capacity. [3] The Twin Groves Wind Farm was the largest wind farm east of the Mississippi when completed but has since been surpassed. [10] [11] Some smaller installations include a 0.66 MW turbine at the Bureau Valley School District and a 2.5 MW turbine at the Illinois Sustainable Technology Center, formerly part of the Illinois Department of Natural Resources, now part of the University of Illinois. [3] A proposed high voltage DC transmission line would transmit wind generated electrical power to the Chicago area from northwest Iowa. [12]

Power from some wind farms in Illinois is sold to the Tennessee Valley Authority. A 2010 agreement with Iberdrola Renewables provides a potential 300MW future supply from the Streator Cayuga Ridge Wind Farm in Livingston County. [13]

Wind farms

Illinois has among the highest densities of wind power Wind power capacity density by state 2013.svg
Illinois has among the highest densities of wind power
Electricity Generation Sources in Illinois Illinois Electricity Generation Sources Pie Chart.svg
Electricity Generation Sources in Illinois
FarmYearInstalled capacity (MW)County [14] Note
Mendota Hills 2003/201951.66/76LeeTurbines replaced in 2019
Crescent Ridge200554.45Bureau
Pike County20051.65Pike
GSG200780Lee/LaSalle
Camp Grove 2007150Marshall/Stark
Twin Groves I-II2007-2008396McLean
AgriWind20088.4Bureau
Grand Ridge I-IV2008-2009210LaSalle
Providence Heights200872Bureau
EcoGrove2009100.5Stephenson
Rail Splitter 2009100.5Logan/Tazewell
Lee-DeKalb2009217.5Lee/DeKalb
Cayuga Ridge 2009300Livingston
Geneseo20093Henry
Top Crop I-II2009-2010300LaSalle
Streator Cayuga Ridge 2010150Livingston
Walnut Ridge2010212Bureau
White Oak2011150McLean
Big Sky Wind2011239.4Bureau/Lee
Pioneer Trail 2011150Iroquois/Ford
Settlers Trail2011150Iroquois
Shady Oaks [15] 2012109.5Lee
Bishop Hill 2012200Henry
Minonk2012200Woodford/Livingston
California Ridge [16] 2012217.1Vermilion/Champaign
Bishop Hill I-II 201281Henry
Heartland Community College20121.65McLean
Pilot Hill2014175Iroquois/Kankakee
Brown County20141.5Brown
Hoopeston 201598Vermilion
Kelly Creek [17] 2016184Kankakee/Ford
Radford Run2017306Macon
Bishop Hill III 2018132Henry
HillTopper 2018185Logan
Whitney Hill 201966Logan
Bright Stalk 2019205McLean
Green River2019194Lee/Whiteside
Cardinal Point2020150McDonough/Warren
Harvest Ridge2020200Douglas
Otter Creek2020158LaSalle
Broadlands2020200Champaign
Sugar Creek 2020202Logan
Blooming Grove2020261McLean
Lone Tree202088Bureau
Lincoln Land2021302Morgan
Glacier Sands2021185Mason [18]
Bennington202193Marshall
Ford Ridge2022120.4Ford
Sapphire Sky2023253.8McLean

Wind generation

Illinois Wind Generation (GWh, Million kWh)
YearJanFebMarAprMayJunJulAugSepOctNovDecTotal % of Production
200321111122111216
20040381095345991378
20056710109532571265141
2006191823292114131015282836254
200728212851644026266610695112663
20082401892012262081608269932292983422,337
2009252302264306204148971471012593294112,820
20103572424025033922182051963735246094324,453
20114075985677235384232392244025129086726,213
20128806138697826415653202774437716089587,727
20131,1858809991,0777665944133235117391,2099299,625
20141,3138491,0691,0978736214983514588421,28582910,0854.98%
20151,0049361,0001,0738905184004446281,1671,3721,31610,7485.54%
20161,2681,1441,0961,0268545914003316939601,0951,20510,6635.69%
20171,1251,2641,3041,2891,0869414714085191,1661,2451,45012,2686.68%
20181,5311,1981,2841,0968596165665716791,1721,0651,26211,8996.33%
20191,4711,3081,4911,6231,1341,0346735629001,2931,2421,72914,4607.24%
20201,3641,5351,6721,6571,3361,0546215431,0701,5422,1591,67316,2268.56%
20211,5371,6432,1131,7701,5531,1468078951,3881,5142,0642,25719,1339.37%
20222,2622,2772,3252,5032,1411,4071,1491,0411,2712,0522,4982,13723,06312.16%
20231,9392,3812,5582,2661,6901,3078631,1751,1732,1562,3022,24322,05412.40%
20242,1682,3654,53314.62%

  Teal background indicates the largest wind generation month for the year.

  Green background indicates the largest wind generation month to date.

Source: [19] [20]

Illinois Wind Generation in 2019
Wind power in Illinois
Net Generation for Wind, Monthly [21]
Illinois Wind Generation in 2020
Wind power in Illinois
Net Generation for Wind, Monthly [22]
Illinois Wind Generation Capacity by Year [23]
Wind power in Illinois
Megawatts of Installed Generating Capacity [24] [25] [26] [27]

See also

Related Research Articles

<span class="mw-page-title-main">Wind power in the United States</span>

Wind power is a branch of the energy industry that has expanded quickly in the United States over the last several years. From January through December 2023, 425.2 terawatt-hours were generated by wind power, or 10.18% of electricity in the United States. The average wind turbine generates enough electricity in 46 minutes to power the average American home for one month. In 2019, wind power surpassed hydroelectric power as the largest renewable energy source in the U.S.

<span class="mw-page-title-main">Wind power in Texas</span> Electricity from wind in one U.S. state

Wind power in Texas, a portion of total energy in Texas, consists of over 150 wind farms, which together have a total nameplate capacity of over 30,000 MW. If Texas were a country, it would rank fifth in the world: The installed wind capacity in Texas exceeds installed wind capacity in all countries but China, the United States, Germany and India. Texas produces the most wind power of any U.S. state. According to the Electric Reliability Council of Texas (ERCOT), wind power accounted for at least 15.7% of the electricity generated in Texas during 2017, as wind was 17.4% of electricity generated in ERCOT, which manages 90% of Texas's power. ERCOT set a new wind output record of nearly 19.7 GW at 7:19 pm Central Standard Time on Monday, January 21, 2019.

<span class="mw-page-title-main">Wind power in California</span> Electricity from large wind farms

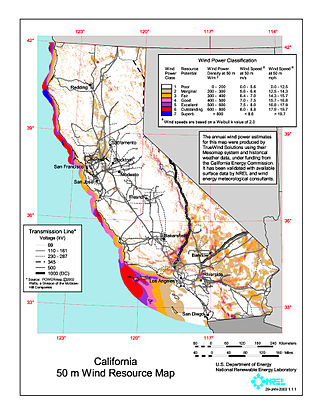
Wind power in California had initiative and early development during Governor Jerry Brown's first two terms in the late 1970s and early 1980s. The state's wind power capacity has grown by nearly 350% since 2001, when it was less than 1,700 MW. In 2016, wind energy supplied about 6.9% of California's total electricity needs, or enough to power more than 1.3 million households. Most of California's wind generation is found in the Tehachapi area of Kern County, California, with some large projects in Solano, Contra Costa and Riverside counties as well. California is among the states with the largest amount of installed wind power capacity. In recent years, California has lagged behind other states when it comes to the installation of wind power. It was ranked 4th overall for wind power electrical generation at the end of 2016 behind Texas, Iowa, and Oklahoma. As of 2019, California had 5,973 megawatts (MW) of wind power generating capacity installed.

<span class="mw-page-title-main">Wind power in Iowa</span> Electricity from wind in one U.S. state

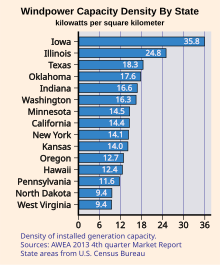
Making up over 62% of the state's generated electricity in 2022, wind power is the largest source of electricity generation in Iowa. In 2020, over 34 billion kWh of electrical energy was generated by wind power. As of 2022, Iowa has over 12,200 megawatts (MW) of installed capacity with over 6,000 wind turbines, ranking second and third in the nation below Texas respectively.

<span class="mw-page-title-main">Wind power in Oregon</span> Electricity from wind in one U.S. state

The U.S. state of Oregon has large wind energy resources. Many projects have been completed, most of them in rural Eastern Oregon and near the Columbia River Gorge. Wind power accounted for 12.1% of the electricity generated in Oregon in 2016.

<span class="mw-page-title-main">Wind power in Washington</span> Electricity from wind in one U.S. state

At the end of 2015, the installed capacity of wind power in Washington was 3,075 megawatts (MW) with wind power accounting for 7,101 GWh. In 2016, it reached a generation of 8,041 GWh, comprising 7.1% of the electricity generated in the state. In 2023, it had a capacity of 3,407 MW, responsible for 7.75% of generation.

<span class="mw-page-title-main">Wind power in Wyoming</span> Electricity from wind in U.S. state

Wyoming has one of the highest wind power potentials of any state in the United States. In 2019, Wyoming had wind powered electricity generating capacity of 1,589 MW, which produced 9.85% of its electric generation, with an additional 3,753 MW under construction. However, the wind generation in that year was Wyoming's third-lowest in the 2010s. By 2020, wind capacity increased to 2738 MW and 8448 gigawatt-hours of electricity were produced from wind in 2021, more than double 2019 production. Additional wind capacity and needed transmission lines are under construction or planned, despite political headwinds from Wyoming's strong coal and oil sectors.

<span class="mw-page-title-main">Wind power in Minnesota</span> Electricity from wind in one U.S. state

At the end of 2016, the installed capacity for wind power in Minnesota was 3,500 megawatts (MW). Wind power generated nearly 18 percent of Minnesota’s electricity in 2016, ranking sixth in the nation for wind energy as a share of total electricity generation.

<span class="mw-page-title-main">Wind power in Montana</span> Electricity from wind in one U.S. state

Wind power in Montana is a growing industry. Montana had over 695 MW of wind generation capability by 2016, responsible for 7.6% of in-state electricity generation.

Wind power in Indiana was limited to a few small water-pumping windmills on farms until 2008 with construction of Indiana's first utility-scale wind power facility, Goodland with a nameplate capacity of 130 MW. As of March of 2024, Indiana had a total of 2,743 MW of wind power capacity installed, ranking it 12th among U.S. states. Wind power was responsible for 4.8% of in-state electricity production in 2016.

<span class="mw-page-title-main">Wind power in Colorado</span> Electricity from wind in one U.S. state

The US state of Colorado has vast wind energy resources and the installed electricity capacity and generation from wind power in Colorado has been growing significantly in recent years. The growth has been sustained due to a combination of falling costs, continuing federal incentives, and the state's aggressive renewable portfolio standard that requires 30% of the state's electricity to come from renewable sources by 2020.

<span class="mw-page-title-main">Renewable energy in South Dakota</span>

Renewable energy in South Dakota involves production of biofuels and generation of electricity from renewable sources of energy such as wind and hydropower. South Dakota is among the states with the highest percentage of electricity generation from renewable resources, typically over 70 percent. In 2011, South Dakota became the first U.S. state to have at least 20% of its electricity generation come from wind power.

<span class="mw-page-title-main">Wind power in North Dakota</span> Electricity from wind in one U.S. state

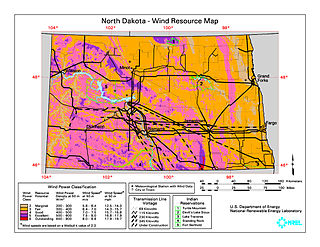
North Dakota is a leading U.S. state in wind power generation. The state generated 26.8% of its electricity from wind during year 2017, enough to power over one million homes.

<span class="mw-page-title-main">Wind power in Michigan</span> Electricity from wind in one U.S. state

Wind power in Michigan is a developing industry. The industrial base from the automotive industry has led to a number of companies producing wind turbine parts in the state. The development of wind farms in the state, however, has lagged behind. In January 2021, there were a total of 1,481 wind turbines in the state with a nameplate capacity of 2,549 MW. The nameplate total exceeded 2,000 MW when Pine River came online in March 2019. Wind provided 4.2% of the state's electricity in 2016.

<span class="mw-page-title-main">Wind power in South Dakota</span> Electricity from wind in one U.S. state

The state of South Dakota is a leader in the U.S. in wind power generation with over 30% of the state's electricity generation coming from wind in 2017. In 2016, South Dakota had 583 turbines with a total capacity of 977 megawatts (MW) of wind generation capacity. In 2019, the capacity increased to 1525 MW.

<span class="mw-page-title-main">Wind power in Oklahoma</span> Electricity from wind in one U.S. state

The U.S. State of Oklahoma has high potential capacity for wind power in the western half of the state. In 2021, Oklahoma's installed wind generation capacity was almost 10,500 megawatts, supplying over 40% of the state's generated electricity and 85% of Oklahoma's total generating capacity from all renewable resources.

<span class="mw-page-title-main">Wind power in Idaho</span> Electricity from wind in one U.S. state

Wind power in Idaho could generate more energy than the state uses.

As of the end of 2021, New Mexico had 4,001 megawatts (MW) of wind powered electricity generating capacity, responsible for 30% of electricity produced that year. Wind power in New Mexico has the potential to generate more than all of the electricity consumed in the state.

<span class="mw-page-title-main">Wind power in Hawaii</span> Electricity from wind in one U.S. state

Wind power in Hawaii is produced by the state's 132 commercial wind turbines, totaling 236 MW in capacity. In 2015, wind turbines produced 6.4% of Hawaii's electricity. In 2012, Hawaii generated 367 million kWh from wind power.

<span class="mw-page-title-main">Wind power in Nebraska</span> Electricity from wind in one U.S. state

Wind power in Nebraska remains largely untapped in comparison with its potential. In the Great Plains, with more than 47,000 farms and open skies it ranks near the top in the United States in its ability to generate energy from wind. As of 2015, the state had not adopted a renewable portfolio standard. Omaha Public Power District (OPPD) is one of the state's largest purchasers of wind energy.

References

  1. "WINDExchange: Wind Energy in Illinois". windexchange.energy.gov. Retrieved November 13, 2021.
  2. "Illinois - State Energy Profile Analysis - U.S. Energy Information Administration (EIA)". www.eia.gov. Retrieved November 13, 2021.
  3. 1 2 3 U.S. Wind Energy Projects - Illinois Archived 2010-01-05 at the Wayback Machine , American Wind Energy Association (AWEA)
  4. "Illinois Incentives/Policies for Renewables & Efficiency". Database of State Incentives for Renewables and Efficiency. U.S. Dept. of Energy. Archived from the original on July 16, 2011. Retrieved May 17, 2010.
  5. "Electric Power Monthly, February 2014". U.S. Energy Information Administration.{{cite web}}: Missing or empty |url= (help)
  6. "Fix for Illinois renewable energy law faces utility opposition". midwestenergynews.com. Archived from the original on March 13, 2017. Retrieved April 26, 2018.
  7. "Wind Energy Facts: Illinois" (PDF). American Wind Energy Association. Archived from the original (PDF) on February 15, 2013. Retrieved February 17, 2013.
  8. 1 2 "WindExchange:Illinois 80-meter wind map and wind resource potential". U.S. Department of Energy, EERE. Archived from the original on July 14, 2014. Retrieved July 2, 2014.
  9. About Wind Power in Illinois Archived 2010-06-07 at the Wayback Machine , Illinois Wind Energy Association
  10. AWEA treats Twin Groves as four installations. Together they exceed the capacity of Cayuga Ridge.
  11. Lookout puts wind farm in perspective Archived 2011-06-13 at the Wayback Machine , Steve Stein, Peoria Journal Star, June 14, 2008
  12. "Rock Island Clean Line files application with FERC" (PDF). Clean Line Energy Partners. November 8, 2011. Retrieved February 3, 2012.
  13. "TVA: Energy Purchases from Wind Farms". tva.com. Archived from the original on July 31, 2015.
  14. "Illinois Wind Power Maps". windforillinois.org. Archived from the original on June 29, 2012. Retrieved April 26, 2018.
  15. Shady Oaks profile Archived 2014-05-11 at the Wayback Machine
  16. "Our Projects - Invenergy". www.invenergyllc.com. Archived from the original on March 16, 2016. Retrieved April 26, 2018.
  17. Kelly Creek Wind Park Commissioned Archived 2016-12-29 at the Wayback Machine
  18. Glacier Sands Wind Project
  19. EIA (May 21, 2013). "Electric Power Monthly". United States Department of Energy. Archived from the original on June 3, 2013. Retrieved June 3, 2013.
  20. "Electricity Data Browser". www.eia.gov. Archived from the original on March 23, 2018. Retrieved April 26, 2018.
  21. "Electricity Data Browser". www.eia.gov. Archived from the original on March 23, 2018. Retrieved April 26, 2018.
  22. "Electricity Data Browser". www.eia.gov. Archived from the original on March 23, 2018. Retrieved April 26, 2018.
  23. "Installed Wind Capacity". U.S. Department of Energy. Archived from the original on March 14, 2014. Retrieved March 19, 2015.
  24. "AWEA 4th quarter 2011 Public Market Report" (PDF). American Wind Energy Association(AWEA). January 2012. Retrieved February 3, 2012.
  25. "AWEA 4th quarter 2018 Public Market Report". American Wind Energy Association(AWEA). January 2012. Retrieved March 6, 2019.
  26. WINDExchange: U.S. Installed and Potential Wind Power Capacity and Generation
  27. "Market Report 2021". American Clean Power Association. May 17, 2022. Retrieved May 22, 2022.