Solar power has been increasing rapidly in the U.S. state of North Carolina, from less than 1 MW (megawatts) in 2007 to 6,152 MW in 2019, when it had the second-largest installed PV capacity of all states. [1]
In addition to federal incentives, the state has a Renewable Portfolio Standard of 12.5% by 2021 and a state renewable energy tax credit, both of which have been credited with boosting solar installations. [2] [3] [4]
A 2018 Smithsonian Magazine article described North Carolina as likely being the national leader in the "solar shepherd phenomenon" – combining sheep farming with solar power plants to reduce the high costs of grass trimming. [5]
According to a report from the Solar Energy Industries Association, as of June 2019, North Carolina generates 5.81% of its electricity through solar power, and ranks second (up from 3rd in 2018) in total installed photovoltaics. [6]
Year | Total (MW) | Installed (MW) | % Change |
---|---|---|---|
2007 | 0.7 | ||
2008 | 4.7 | 4 | 571% |
2009 | 12.5 | 7.8 | 166% |
2010 | 40 | 28.7 | 220% |
2011 | 85.5 | 45.5 | 114% |
2012 | 207.9 | 122.4 | 143% |
2013 | 469 | 261.1 | 126% |
2014 | 849 | 380 | 81% |
2015 | 1,974 | 1,125 | 132% |
2016 | 2,984 | 1,010 | 51% |
2017 | 3,287.5 | 303.5 | 10% |
2018 | 4,692.1 | 1,404.6 | 42.7% |
2019 | 6,152.3 | 1,460.2 | 31% |
2020 | 7,037.8 | 885.5 | 14% |
2021 | 7,811.2 | 773.4 | % |
2022 | 8,179 | 367.8 | % |
This article needs to be updated.(June 2023) |
The following tables show some of the major solar power projects currently operating in North Carolina (NC).
Name | Location | MW | Current status | PV modules | Footprint (acres) |
---|---|---|---|---|---|
Clipperton | Sampson County | 5 | Operational as of 2017 (Nov.) | 56,640 | 28.52 |
Fremont | Wayne County | 5 | Operational as of 2017 (Nov.) | 21,128 | 29.76 |
Gutenberg Solar | Northampton | 79.9 | Operational as of 2019 (Sept.) | 287,430 | 1,126 |
IS37 | Anson County | 79 | Operational as of 2017 (Aug.) | 344,056 | 550 |
Moorings 2 | Lenoir County | 5 | Operational as of 2017 (Nov.) | 58,400 | 36 |
Morgans Corner | Pasquotank County | 20 | Operational as of 2017 (Nov.) | 81,054 | 110 |
Mustang Solar | Moore County | 5 | Operational as of 2018 (July) | 21,300 | 30 |
Pecan Solar | Northampton | 74.9 | Operational as of 2018 (Dec.) | 929,100 | 1,050 |
Pikeville | Wayne County | 5 | Operational as of 2017 (Nov.) | 56,640 | 30 |
Summit Farms | Currituck County | 60 | Operational as of 2016 (Dec.) | 650 | |
Wakefield Solar | Wake County | 5 | Operational as of 2017 (Dec.) | 22,300 | 30 |
Name | Location | MW | Construction completed | PV Modules | Electricity purchaser (offtaker) |
---|---|---|---|---|---|
Battleboro Solar [17] | Edgecombe County | 5 | 2015-04 | 23,300 | Dominion North Carolina Power |
Bethel Price Solar [18] | Pitt County | 5 | 2013-12 | 23,000 | Dominion North Carolina Power |
Capital Partners, Phase I [19] | Elizabeth City | 20 | 2014-12 | 93,000 | George Washington University American University GWU Hospital |
Capital Partners, Phase II [20] | Kelford Whitakers | 33.5 | 2015-12 | 147,300 | George Washington University American University GWU Hospital |
Conetoe II [21] | Edgecombe County | 80 | 2015-09 | 375,000 | Lockheed-Martin (38%) [22] Corning (62%) [23] |
Creswell Solar [24] | Washington County | 14 | 2015-02 | 66,500 | Dominion North Carolina Power |
Davie Solar [25] | Davie County | 29 | 2017 | 63,308 | |
Dogwood Solar [26] | Halifax County | 20 | 2013-12 | 93,000 | |
Everett's Wildcat Solar [27] | Martin County | 5 | 2014-12 | 23,300 | Dominion North Carolina Power |
Halifax Solar Power Project [28] | Roanoke Rapids | 20 | 2014-12 | 100,000 | Dominion North Carolina Power |
Holiness Solar [29] | Murphy | 1 | 2011-11 | 4,242 | Tennessee Valley Authority |
Martins Creek Solar [30] | Murphy | 1 | 4,400 | Tennessee Valley Authority | |
Millfield Solar [31] | Beaufort County | 5 | 2013-11 | 27,450 | North Carolina Eastern Municipal Power Agency |
Monroe Solar [32] | Union County | 60 | 2017 | ||
Murfreesboro Solar [33] | Murfreesboro | 5 | 2011-12 | 19,960 | North Carolina Electric Membership Corporation |
Shawboro Solar [34] | Currituck County | 20 | 2015-12 | 95,000 | Dominion North Carolina Power |
Shelby Solar [35] | Shelby | 1 | 2010-05 | 4,522 | North Carolina Eastern Municipal Power Agency |
Sunbury Solar [36] | Gates County | 5 | 2015-08 | 23,000 | Dominion North Carolina Power |
Taylorsville Solar [37] | Taylorsville | 1 | 2010-10 | 4,224 | EnergyUnited |
Tarboro Solar [38] | Edgecombe County | 5 | 2015-04 | 23,000 | Dominion North Carolina Power |
Washington Airport Solar [39] | Beaufort County | 5 | 2013-12 | 23,000 | North Carolina Eastern Municipal Power Agency |
Washington White Post Solar [40] | Beaufort County | 12.5 | 2012-12 | 53,000 | North Carolina Eastern Municipal Power Agency |
Wingate Solar [41] | Murphy | 1 | 2011-08 | 4,340 | Tennessee Valley Authority |
Windsor Cooper Hill Solar [42] | Bertie County | 5 | 2013 | 23,000 | Dominion North Carolina Power |
Name | Location | MW | Construction completed | PV modules |
---|---|---|---|---|
Camp Lejeune Solar [43] | Onslow County | 17.25 | 2017-03 | 55,000 |
Elm City Solar [44] [45] | Wilson County | 40 | 2016-06 | 487,000 |
Fayetteville Solar [46] | Cumberland County | 23 | 2015-12 | 105,000 |
Warsaw Solar [47] | Duplin County | 65 | 2016-06 | 850,000 |
On September 15, 2014, Duke Energy committed US$500 million to an expansion of solar power in North Carolina. [48] Announced projects include:
In addition, Duke Energy plans to purchase energy from five new projects:
Name | Location | MW | Construction completed |
---|---|---|---|
NC 102 [49] | Cabarrus County | 74.8 (102 MWP) | 2018 |
IS-42 [50] | Cumberland County | 71 (92 MWP) | 2018 |
This article needs to be updated.(June 2023) |
Using data available from the U.S. Energy Information Agency's Electric Power Annual 2017 [51] and "Electric Power Monthly Data Browser", [52] [53] [54] [55] the following table summarizes North Carolina's solar energy posture.
Year | Facilities | Summer capacity (MW) | Electric energy (GWh or M kWh) | Capacity factor | Yearly growth of generating capacity | Yearly growth of produced energy | % of NC renewable electric energy | % of NC generated electric energy | % of U.S. Solar electric energy |
---|---|---|---|---|---|---|---|---|---|
2018 | 523 | 3982 | 6997 | 0.201 | 18.7% | 25.4% | 53.5% | 5.2% | 10.5% |
2017 | 481 | 3355 | 5579 | 0.190 | 37.7% | 63.1% | 51.6% | 4.3% | 10.5% |
2016 | 411 | 2437 | 3421 | 0.16 | 69.6% | 149% | 32.9% | 2.6% | 9.5% |
2015 | 262 | 1436.8 | 1374 | 0.11 | 112.5% | 88.5% | 15.8% | 1.07% | 5.5% |
2014 | 676 | 729 | 0.123 | 103% | 111% | 9.10% | 0.60% | 4.10% | |
2013 | 84 | 333.2 | 345 | 0.176 | 190.8% | 148.2% | 3.5% | 0.27% | 3.82% |
2012 | 38 | 114.6 | 139 | 0.199 | 156.4% | 717.7% | 2.16% | 0.12% | 3.21% |
2011 | 15 | 44.7 | 17 | 0.049 | 27.7% | 54.6% | 0.27% | 0.01% | 0.94% |
2010 | 9 | 35 | 11 | 0.066 | 1067% | 120% | 0.16% | 0.01% | 0.91% |
2009 | 3 | 3 | 5 | 0.190 | 0% | 150% | 0.07% | 0.00% | 0.56% |
2008 | 3 | 3 | 2 | 0.152 | 0% | 0% | 0.04% | 0.00% | 0.23% |
2007 | 0 | 0 | 0 | 0 | 0% | 0% | 0.00% | 0.00% | 0.00% |
Capacity factor for each year was computed from the end-of-year summer capacity. 2018 data is from Electric Power Monthly and is subject to change.
NC Utility Scale solar generation (GWh, Million kWh) [56] [57] | |||||||||||||
---|---|---|---|---|---|---|---|---|---|---|---|---|---|
Year | Jan | Feb | Mar | Apr | May | Jun | Jul | Aug | Sept | Oct | Nov | Dec | Total |
2011 | 17 | ||||||||||||
2012 | 2 | 2 | 4 | 6 | 6 | 6 | 9 | 7 | 9 | 17 | 23 | 48 | 139 |
2013 | 10 | 17 | 24 | 21 | 32 | 34 | 34 | 32 | 36 | 40 | 30 | 35 | 345 |
2014 | 31 | 41 | 56 | 58 | 74 | 67 | 69 | 75 | 68 | 88 | 49 | 54 | 729 |
2015 | 63 | 52 | 95 | 110 | 160 | 151 | 167 | 156 | 109 | 100 | 76 | 135 | 1,374 |
2016 | 168 | 175 | 348 | 300 | 265 | 320 | 336 | 448 | 328 | 254 | 182 | 298 | 3,421 |
2017 | 265 | 335 | 423 | 477 | 534 | 482 | 537 | 480 | 473 | 423 | 372 | 314 | 5,115 |
2018 | 402 | 356 | 514 | 632 | 629 | 677 | 643 | 658 | 440 | 483 | 369 | 308 | 6,111 |
2019 | 410 | 398 | 661 | 680 | 772 | 753 | 838 | 749 | 683 | 556 | 481 | 472 | 7,451 |
2020 | 477 | 492 | 641 | 872 | 873 | 850 | 955 | 766 | 650 | 660 | 552 | 484 | 8,274 |
2021 | 517 | 520 | 817 | 1018 | 1085 | 990 | 1037 | 986 | 916 | 775 | 715 | 548 | 9,922 |
2022 | 635 | 719 | 969 | 1157 | 1173 | 1251 | 1174 | 1111 | 1048 | 938 | 664 | 534 | 11,373 |
Beginning with the 2014 data year, the Energy Information Administration (EIA) has estimated the distributed solar-photovoltaic generation and distributed solar-photovoltaic capacity. [58] These non-utility-scale appraisals evaluate that North Carolina generated the following amounts of additional solar energy:
Year | Summer capacity (MW) | Electric energy (GWh or M kWh) |
---|---|---|
2018 | 140.1 | 212 |
2017 | 114.9 | 186 |
2016 | 109.7 | 167 |
2015 | 71.7 | 84 |
2014 | 56.8 | 72 |
On January 22, 2018, Duke Energy Renewables proposed a $62 million rebate program for both residential and nonresidential customers. It was the first of three programs Duke is proposing as part of "Competitive Energy Solutions for North Carolina" legislation, signed into law in 2017 by Gov. Roy Cooper. The program requires approval from the North Carolina Utilities Commission. [60]
Electricity customer | Eligible rebate | Maximum rebate |
---|---|---|
Residential (10 kilowatts or less) | 60 cents per watt | $6,000 |
Nonresidential | 50 cents per watt | $50,000 |
Nonprofit entity | 75 cents per watt | $75,000 |
Customers would also have the option of leasing solar equipment from a third-party.
On April 16, 2018, the North Carolina Utilities Commission approved the program. It applies to Duke Energy's residential, nonresidential and nonprofit customers who installed a solar system and a bi-directional meter on their property on or after January 1, 2018. [61]
Solar power in Nevada is growing due to a Renewable Portfolio Standard which requires 50% renewable energy by 2030. The state has abundant open land areas and some of the best solar potential in the country.
Solar power in Arizona has the potential to, according to then-Governor Janet Napolitano, make Arizona "the Persian Gulf of solar energy". In 2012, Arizona had 1,106 MW of photovoltaic (PV) solar power systems, and 6 MW of concentrated solar power (CSP), bringing the total to over 1,112 megawatts (MW) of solar power. As an example, the Solana Generating Station, a 280 MW parabolic trough solar plant, when commissioned in 2013, was the largest parabolic trough plant in the world and the first U.S. solar plant with molten salt thermal energy storage.
Solar power in Colorado has grown rapidly, partly because of one of the most favorable net metering laws in the country, with no limit on the number of users. The state was the first in the nation to establish a Renewable Portfolio Standard for its electric utilities.
Solar power in Florida has been increasing, as the cost of solar power systems using photovoltaics (PV) has decreased in recent years. Florida has low electricity costs compared with other states, which makes individual solar investment less attractive. Florida ranks ninth nationally in solar resource strength according to the National Renewable Energy Laboratory and tenth in solar generation by the Solar Energy Industries Association.
Solar power in Texas, a portion of total energy in Texas, includes utility-scale solar power plants as well as local distributed generation, mostly from rooftop photovoltaics. The western portion of the state especially has abundant open land areas, with some of the greatest solar and wind potential in the country. Development activities there are also encouraged by relatively simple permitting and significant available transmission capacity.
Solar power in Nebraska is used for only a very small percentage of the state's electricity, although it is rapidly becoming competitive with grid electricity, due to the decrease in cost and the eight-year extension to the 30% tax credit, which can be used to install systems of any size. In 2015, the state ranked 47th among the 50 U.S. states with 1.1 MW of installed capacity.
Solar power in Louisiana is ranked 34th for installed solar PV capacity as of 2017 by the Solar Energy Industry Association. The state's "solar friendliness" according to Solar Power Rocks has fallen to 50th place for 2018 as the state credit program ends and full 1:1 retail net metering is being phased out. Taxpayers still benefit from federal incentive programs such as the 30 percent tax credit, which applies to business and residential solar photovoltaic and thermal energy systems of any size.
Solar power in Ohio has been increasing, as the cost of photovoltaics has decreased. Ohio installed 10 MW of solar in 2015. Ohio adopted a net metering rule which allows any customer generating up to 25 kW to use net metering, with the kilowatt hour surplus rolled over each month, and paid by the utility once a year at the generation rate upon request. For hospitals there is no limit on size, but two meters are required, one for generation, the other for utility supplied power.
Solar power in Wyoming has the potential to generate 72 million MWh/yr. Wyoming used 12 million MWh in 1999. Net metering is available to all consumers generating up to 25 kW. The state has an installed capacity of 146 MW as of 2022.
Solar power in Indiana has been growing in recent years due to new technological improvements and a variety of regulatory actions and financial incentives, particularly a 30% federal tax credit for any size project.
Solar power in Iowa is limited but growing, with 137 megawatts (MW) installed by the end of 2019 and 27 MW installed during that year, ranking the state 40th among U.S. states. Iowa also generated 0.23% of the state's total electricity production in 2019 from solar energy; an amount sufficient to power over 17,000 Iowa homes. The state's early position as a major wind-power provider may have limited early large-scale solar investment.
Solar power in Oklahoma can provide 44.1% of all electricity used in Oklahoma from 19,300 MW of rooftop solar panels. This scenario is extremely unlikely though because the cost of electricity in Oklahoma is among the lowest in the nation.
Solar power in Alabama on rooftops could theoretically provide 29.8% of all electricity used in Alabama, with 20,400 MW of solar panels potentially installed on rooftops.
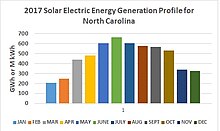
Solar power in Georgia on rooftops can provide 31% of all electricity used in Georgia.
Solar power in Illinois has been increasing, as the cost of photovoltaics has decreased. As of the end of 2020, Illinois had 465 megawatts (MW) of installed photovoltaic and concentrated solar power capacity combined employing over 5,200 jobs. Illinois adopted a net metering rule which allows customers generating up to 40 kW to use net metering, with the kilowatt hour surplus rolled over each month, and lost at the end of either April or October, as selected by the customer. In 2011, the limit was raised to 2 MW, but is not net metering, as the term is commonly known, as it uses two meters for systems larger than 40 kW.
Solar power in Minnesota expanded significantly in the early 2010s as a result of the cost decrease of photovoltaics and favorable policies. By 2016, it began to grow quickly.
Solar power in Maryland is supported by the state's legislation regarding the Renewable Portfolio Standard and Solar Renewable Energy Credit (SREC) program. The target for renewable energy as of 2017 is 20% by 2020, including 2% from solar power.
Solar power in Montana on rooftops could provide 28% of all electricity used in Montana from 3,200 MW of solar panels.
Solar power in Vermont provides almost 11% of the state's in-state electricity production as of 2018. A 2009 study indicated that distributed solar on rooftops can provide 18% of all electricity used in Vermont. A 2012 estimate suggests that a typical 5 kW system costing $25,000 before credits and utility savings will pay for itself in 10 years, and generate a profit of $34,956 over the rest of its 25-year life.
Solar power in Delaware is small industry. Delaware had 150 MW of total installed capacity in 2020. The largest solar farms in the state included the 10 MW Dover Sun Park and the 12 MW Milford Solar Farm.