Solar power in Pennsylvania

Last updated
Solar panels in Myerstown. 20110420-RD-LSC-0880 - Flickr - USDAgov.jpg
Solar panels in Myerstown.

Solar power in Pennsylvania currently provides less than 1% of the state's electricity, but there are many policies in place to regulate and incentivize its use. Pennsylvania mandates the use of solar power through a renewable portfolio standard, which requires a percentage of electricity from each providers to come from solar, and net metering, which compensates small-scale solar generation through net metering. By 2021, Pennsylvania was required to have 0.5% of its electricity from solar. Their following goal is 10% by 2030. Solar power could theoretically provide over 30% of the state's electricity, but growth in solar generation has slowed due to a reduction in solar grants and the low price of solar energy credits. Efforts have also seen blowback from citizens, most notably from Mount Joy Township. Although, Pennsylvania has ruled solar as a legal use, meaning local governments can only restrict size and placement, but can't disband the projects.

Contents

Solar power policies

Cleaning solar panels, Palmyra Cleaning solar panels, Palmyra, Pennsylvania.jpg
Cleaning solar panels, Palmyra

Net metering

Net metering is available to all residential customers up to 50 kW and others up to at least 3 MW. [1] Excess generation is credited at retail rate to customer's next bill, and paid annually at "price-to-compare" (normally referred to as "avoided cost"). Best practices call for no limits (other than to customer's service entrance rating), and perpetual roll over of kilowatt credits, instead of converting to a monetary credit. Annual reconciliation can create problems as annual generation for wind and solar inherently varies from year to year, and during the year large credit surpluses can accrue that would be later consumed, which is why perpetual roll over of kilowatt credits is recommended. Converting to a monetary credit is not recommended because electric rates change over time. In the event that the generation installed is larger than needed to meet local demand, an optional compensation is more practical than a mandatory method, even if the compensation is at retail. [2]

Alternative Energy Portfolio Standard

Pennsylvania has a renewable portfolio standard titled Alternative Energy Portfolio Standard (AEPS), which mandates use of solar photovoltaics (PV) for electricity. All electrical utilities in Pennsylvania must supply a percentage of their electricity from alternative sources, which fall into two tiers: Tier I, which includes biomass, wind, and geothermal; and Tier II, which includes waste coal, gasification (syngas), and utility-scale hydropower. [3] Each tier has a separate standard; by 2021, 8% of generation must come from Tier I, and 10% must come from Tier II. [4] Solar PV and solar thermal fall under Tier I, but the AEPS also contains a requirement that a percentage of Tier I electricity be generated specifically from solar PV – 0.5% by 2021. [3] [4]

To comply with the standard, Pennsylvania utilities must obtain Alternative Energy Credits (AECs), which are equal to one megawatt-hour (MWh) of energy generated from Tier I or Tier II sources. Surplus AECs can be bought and sold between utilities or stored for a maximum of two years before being used. [5] Utilities that do not comply must pay an alternative compliance payment (ACP), which goes to the state's Sustainable Energy Funds. [5] The ACP for solar PV is dependent on the cost of solar PV electricity (in 2016 it was $124.14), while for all other sources the ACP is set at $45. [6]

Pennsylvania solar energy market

Map of Pennsylvania commercial solar power plants PA solar plants.png
Map of Pennsylvania commercial solar power plants

Solar energy has failed to penetrate the Pennsylvania energy market to the extent that it has in other states due to in part to inconsistent financial incentives. In 2009, Pennsylvania created the PA Sunshine Rebate program, which allocated $100 million in state funds to offer rebates for small-scale solar installations. [7] [8] This program led to a short-term increase in the rate solar installations. Since then, the program has run out of funding and is no longer offering rebates, causing the number of new installations to drop. It has been replaced by the Solar Loan Program, which provides loans for building components for solar plants and for installing new solar generation. [9] In addition, several Pennsylvania utilities offer grant, rebate, and loan programs for solar applications. [10] [11]

Total and newly installed solar capacity in Pennsylvania by year Solar Power Capacity in PA by Year.png
Total and newly installed solar capacity in Pennsylvania by year

Solar generation in Pennsylvania has also been made less financially attractive by low prices for solar alternative energy credits (SAECs). [7] This is due to an oversupply of SAECs compared to what is required under the AEPS. [8] Pennsylvania accepts SAECs from out-of-state solar generation within the PJM Interconnection, regardless of whether the state has a renewable portfolio standard. [12] This allows Pennsylvania-based electrical providers to buy out-of-state SAECs cheaply rather than build new solar generation within the state. The influx of out-of-state credits causes the supply of SAECs to exceed the total number required for compliance, resulting in low prices for credits and a reduced incentive to construct solar power facilities in Pennsylvania. [7] [8]

Solar panels installed at Phipps Conservatory Phipps Conservatory 24.jpg
Solar panels installed at Phipps Conservatory

The average price of Pennsylvania SAECs peaked in 2010 at $310. [13] Since the beginning of 2013, prices have fluctuated between $12 and $60. [13] As of October 2017, the price has fallen to $3.50. [14]

The following table summarizes the growth of solar power capacity and generation in Pennsylvania.

Solar Capacity and Generation in Pennsylvania [5] [15] [16] [17] [18] [19] [20] [21] [22] [23] [24]
YearTotal Solar Capacity (MW)Newly Installed Capacity (MW)Total Electricity from Solar (thousand MWh)Percentage of Electricity from SolarPercent Solar in AEPS
20070.90.100.0126%0.0013%
20083.93.000.0152%0.0030%
20097.34.440.0193%0.0063%
201054.846.580.0373%0.0120%
2011133.178.2230.0671%0.0203%
2012164.331.3320.0828%0.0325%
2013180.215.9630.0915%0.0510%
201424565620.142%0.0840%
201525813640.151%0.1440%
201630042750.168%
201736161700.200%
201842059620.22%
201949575830.25%
2020761.6266.61860.31%
2021873.9112.30.41%
20221,036162.10.43%

Table Key:

Total Solar Capacity: The U.S. Energy Information Administration (EIA) best describes total solar capacity as the maximum output of electricity that a generator can produce under perfect conditions. [25]

Newly Installed Capacity: Also referred to as the ICAP, refers to the maximum capacity that the system is expected to run at. Also referred to as “peak installed capacity”. [26]

Outlook

Average incoming solar radiation for the United States; Pennsylvania receives less than much of the country NREL USA CSP map hi-res 2008.jpg
Average incoming solar radiation for the United States; Pennsylvania receives less than much of the country

Solar power in Pennsylvania has potential for expansion and could both reduce greenhouse gas emissions and improve public health, but growth is limited by the state's low sun exposure. If all usable rooftop space in Pennsylvania had photovoltaic panels installed, those panels would be capable of providing 34.5% of the state's electricity. [27] Each kilowatt of installed solar capacity has a societal benefit of over $100 in parts of western and southeastern Pennsylvania, when combining environmental and public health benefits from emissions reductions. [28] However, solar plants in Pennsylvania frequently have low capacity factors (ratio of power produced to maximum possible power), in large part due to low levels of incoming solar radiation. [28] The state on average receives approximately 60% - 65% as much radiation as the southwest United States.

The requirements for solar generation stop increasing under the Pennsylvania AEPS in 2021, when it will remain at 0.5% going forward. Using funding from the U.S. Department of Energy, the state began a new program in 2017, Finding Pennsylvania's Solar Future, that aims to take input from stakeholders and produce new policy recommendations regarding solar power in the state. [29] A preliminary goal is to increase the percentage of electricity sales coming from in-state solar to 10%, with a final goal and timeline for implementation to be determined. [30]

In February 2022, Sheetz announced a long-term renewable supply agreement that would provide solar power for about 70% of its Pennsylvania facilities by 2024. [31]

See also

Related Research Articles

<span class="mw-page-title-main">Solar power in Nevada</span> Overview of solar power in the U.S. state of Nevada

Solar power in Nevada is growing due to a Renewable Portfolio Standard which requires 50% renewable energy by 2030. The state has abundant open land areas and some of the best solar potential in the country.

<span class="mw-page-title-main">Solar power in New Mexico</span> Overview of solar power in the U.S. state of New Mexico

Solar power in New Mexico in 2016 generated 2.8% of the state's total electricity consumption, despite a National Renewable Energy Laboratory (NREL) projection suggesting a potential contribution three orders of magnitude larger.

<span class="mw-page-title-main">Solar power in Connecticut</span> Overview of solar power in the U.S. state of Connecticut

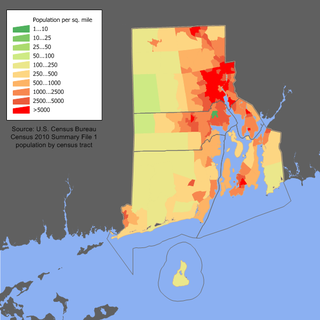
Solar power in Connecticut establishes Connecticut as the second state in the US to reach grid parity, after Hawaii, due to the high average cost of electricity. Installing solar panels for a home provides an estimated 15.6% return on investment.

<span class="mw-page-title-main">Solar power in Nebraska</span> Overview of solar power in the U.S. state of Nebraska

Solar power in Nebraska is used for only a very small percentage of the state's electricity, although it is rapidly becoming competitive with grid electricity, due to the decrease in cost and the eight-year extension to the 30% tax credit, which can be used to install systems of any size. In 2015, the state ranked 47th among the 50 U.S. states with 1.1 MW of installed capacity.

<span class="mw-page-title-main">Solar power in Washington (state)</span>

As of the first quarter of 2023, Washington State has 604 MW of solar power electricity generation. This is an increase from about 300 MW in 2021 and 27 MW in 2013.

<span class="mw-page-title-main">Solar power in Louisiana</span> Overview of solar power in the U.S. state of Louisiana

Solar power in Louisiana is ranked 34th for installed solar PV capacity as of 2017 by the Solar Energy Industry Association. The state's "solar friendliness" according to Solar Power Rocks has fallen to 50th place for 2018 as the state credit program ends and full 1:1 retail net metering is being phased out. Taxpayers still benefit from federal incentive programs such as the 30 percent tax credit, which applies to business and residential solar photovoltaic and thermal energy systems of any size.

<span class="mw-page-title-main">Solar power in Kentucky</span>

Solar power in Kentucky has been growing in recent years due to new technological improvements and a variety of regulatory actions and financial incentives, particularly a 30% federal tax credit, available through 2016, for any size project. Kentucky could generate 10% of all of the electricity used in the United States from land cleared from coal mining in the state. Covering just one-fifth with photovoltaics would supply all of the state's electricity.

<span class="mw-page-title-main">Solar power in Ohio</span> Overview of solar power in the U.S. state of Ohio

Solar power in Ohio has been increasing, as the cost of photovoltaics has decreased. Ohio installed 10 MW of solar in 2015. Ohio adopted a net metering rule which allows any customer generating up to 25 kW to use net metering, with the kilowatt hour surplus rolled over each month, and paid by the utility once a year at the generation rate upon request. For hospitals there is no limit on size, but two meters are required, one for generation, the other for utility supplied power.

<span class="mw-page-title-main">Solar power in Utah</span>

The U.S. state of Utah has the solar potential to provide all of the electricity used in the United States. Utah is one of the seven states with the best potential for solar power, along with California, Nevada, Arizona, New Mexico, Colorado, and Texas. Utah's only investor owned utility currently allows partial net metering for residential systems up to 25 kW and up to 2 MW for non-residential users. In the past RMP allowed full net metering, and partial net metering. Neither of these Schedules allows for new customers to sign up any longer. Utah's municipal utilities and electric cooperatives set their own net metering policies.

<span class="mw-page-title-main">Solar power in Rhode Island</span> Overview of solar power in the U.S. state of Rhode Island

Solar power in Rhode Island has become economical due to new technological improvements and a variety of regulatory actions and financial incentives, particularly a 30% federal tax credit, available through 2016, for any size project. A typical residential installation could pay for itself in utility bill savings in 14 years, and generate a profit for the remainder of its 25 year life. Larger systems, from 10 kW to 5 MW, receive a feed-in tariff of up to 33.45¢/kWh.

<span class="mw-page-title-main">Solar power in Indiana</span> Overview of solar power in the U.S. state of Indiana

Solar power in Indiana has been growing in recent years due to new technological improvements and a variety of regulatory actions and financial incentives, particularly a 30% federal tax credit for any size project.

<span class="mw-page-title-main">Solar power in Maine</span> Overview of solar power in the U.S. state of Maine

Solar power in Maine on rooftops, utilizing 6,300 megawatts (MW) of solar panels, can provide 60% of the electricity used in Maine according to a 2016 U.S. Department of Energy study. Maine and Vermont are tied for the second highest rooftop solar potential in the country, only behind the state of California. A 2020 estimate suggests that a typical 5.6 kilowatt (kW) residential system will pay for itself in 6-7 years and generate a profit of $45,000 over the rest of its 25-year life from the tax credits and utility savings.

<span class="mw-page-title-main">Solar power in Georgia (U.S. state)</span> Overview of solar power in the U.S. state of Georgia

Solar power in Georgia on rooftops can provide 31% of all electricity used in Georgia.

<span class="mw-page-title-main">Solar power in Minnesota</span> Overview of solar power in the U.S. state of Minnesota

Solar power in Minnesota expanded significantly in the early 2010s as a result of the cost decrease of photovoltaics and favorable policies. By 2016, it began to grow quickly.

<span class="mw-page-title-main">Solar power in Maryland</span> Overview of solar power in the U.S. state of Maryland

Solar power in Maryland is supported by the state's legislation regarding the Renewable Portfolio Standard and Solar Renewable Energy Credit (SREC) program. The target for renewable energy as of 2017 is 20% by 2020, including 2% from solar power.

<span class="mw-page-title-main">Solar power in Missouri</span> Overview of solar power in the U.S. state of Missouri

Solar power in Missouri has been a growing industry since the early 2010s. Solar power is capable of generating 42.7% of the electricity used in Missouri from rooftop solar panels totaling 28,300 MW.

<span class="mw-page-title-main">Solar power in New Hampshire</span> Overview of solar power in the U.S. state of New Hampshire

Solar power in New Hampshire provides a small percentage of the state's electricity. State renewable requirements and declining prices have led to some installations. Photovoltaics on rooftops can provide 53.4% of all electricity used in New Hampshire, from 5,300 MW of solar panels, and 72% of the electricity used in Concord, New Hampshire. A 2016 estimate suggests that a typical 5 kW system costing $25,000 before credits and utility savings will pay for itself in 9 years, and generate a profit of $34,196 over the rest of its 25-year life. A loan or lease provides a net savings each year, including the first year. New Hampshire has a rebate program which pays $0.75/W for residential systems up to 5 kW, for up to 50% of the system cost, up to $3,750. However, New Hampshire's solar installation lagged behind nearby states such as Vermont and New York, which in 2013 had 10 times and 25 times more solar, respectively.

<span class="mw-page-title-main">Solar power in Vermont</span> Overview of solar power in the U.S. state of Vermont

Solar power in Vermont provides almost 11% of the state's in-state electricity production as of 2018. A 2009 study indicated that distributed solar on rooftops can provide 18% of all electricity used in Vermont. A 2012 estimate suggests that a typical 5 kW system costing $25,000 before credits and utility savings will pay for itself in 10 years, and generate a profit of $34,956 over the rest of its 25-year life.

<span class="mw-page-title-main">Solar power in Wisconsin</span> Overview of solar power in the U.S. state of Wisconsin

Solar power in Wisconsin In 2026, Wisconsin rooftops can accommodate approximately 37 GWs of solar capacity and produce 44,183 GWh of electricity, nearly 70% of the statewide generation in 2019. Net metering is available for systems up to at least 20 kW, and excess generation is credited at retail rate to customers next bill. Some utilities allow net metering up to 100 kW. For Xcel customers, kilowatt credits are rolled over monthly and are reconciled annually at avoided cost. Best practices recommend no limits, either individually or aggregate, and perpetual roll over of kilowatt credits.

<span class="mw-page-title-main">Solar power in Delaware</span>

Solar power in Delaware is small industry. Delaware had 150 MW of total installed capacity in 2020. The largest solar farms in the state included the 10 MW Dover Sun Park and the 12 MW Milford Solar Farm.

References

  1. Database of State Incentives for Renewables and Efficiency (23 Jan 2017). "Net Metering". DSIRE. Retrieved 10 Oct 2017.
  2. Interstate Renewable Energy Council (2009). "IREC Model Net Metering Rules 2009". IREC. Retrieved 10 Oct 2017.
  3. 1 2 Pennsylvania General Assembly, 2004. Alternative Energy Portfolio Standards Act, United States: State of Pennsylvania. Available at: http://www.legis.state.pa.us/cfdocs/legis/li/uconsCheck.cfm?yr=2004&sessInd=0&act=213 .
  4. 1 2 Pennsylvania General Assembly, 2007. Alternative Energy Portfolio Standards Act - Alternative Energy Portfolio Standards, Portfolio Requirements In Other States and Interconnection Standards for Customer-Generator Facilities, United States: State of Pennsylvania. Available at: http://www.legis.state.pa.us/cfdocs/Legis/LI/uconsCheck.cfm?txtType=HTM&yr=2007&sessInd=0&smthLwInd=0&act=35.
  5. 1 2 3 Database of State Incentives for Renewables and Efficiency (24 Jan 2017). "Alternative Energy Portfolio Standard". DSIRE. Retrieved 10 Oct 2017.
  6. Pennsylvania Alternative Energy Portfolio Standard Program (2016). "Energy Year 2016 ACP and Average Solar and Tier II Prices Released". Pennsylvania Public Utility Commission. Retrieved 10 Oct 2017.
  7. 1 2 3 Warwood, Amanda (15 June 2016). "Solar in Philadelphia - Part 1: Where We Are". City of Philadelphia. Archived from the original on 2016-10-08. Retrieved 10 Oct 2017.
  8. 1 2 3 SRECTrade (16 Feb 2012). "Why are Pennsylvania SREC prices so low?". SRECTrade. Retrieved 10 Oct 2017.
  9. Pennsylvania Department of Community & Economic Development. "Solar Energy Program (SEP)". PA DCED. Retrieved 10 Oct 2017.
  10. Database of State Incentives for Renewables and Efficiency (2017). "Programs: Pennsylvania". DSIRE. Retrieved 10 Oct 2017.
  11. U.S. Department of Energy (Oct 2015). "Energy Incentive Programs, Pennsylvania". Office of Energy Efficiency & Renewable Energy. Archived from the original on 2014-10-09. Retrieved 10 Oct 2017.
  12. Database of State Incentives for Renewables and Efficiency (5 May 2015). "Solar Alternative Energy Credits". DSIRE. Retrieved 10 Oct 2015.
  13. 1 2 SRECTrade. "Historic Auction Prices". SRECTrade. Retrieved 10 Oct 2017.
  14. SRECTrade. "Markets - Pennsylvania". SRECTrade. Retrieved 10 Oct 2017.
  15. Sherwood, Larry (August 2012). "U.S. Solar Market Trends 2011" Archived 2012-09-06 at the Wayback Machine (PDF). Interstate Renewable Energy Council (IREC). p. 17. Retrieved 2012-08-16.
  16. Sherwood, Larry (July 2014). "U.S. Solar Market Trends 2013"(PDF). Interstate Renewable Energy Council (IREC). Retrieved 2014-09-26.
  17. Sherwood, Larry (June 2011). "U.S. Solar Market Trends 2010"(PDF). Interstate Renewable Energy Council (IREC). Retrieved 2011-06-29.
  18. Sherwood, Larry (July 2010). "U.S. Solar Market Trends 2009" Archived 2010-09-25 at the Wayback Machine (PDF). Interstate Renewable Energy Council (IREC). Retrieved 2010-07-28.
  19. Sherwood, Larry (July 2009). "U.S. Solar Market Trends 2008" Archived 2009-11-23 at the Wayback Machine (PDF). Interstate Renewable Energy Council (IREC). Retrieved 2010-07-24.
  20. Sherwood, Larry (August 2008). "U.S. Solar Market Trends 2007" [ permanent dead link ](PDF). Interstate Renewable Energy Council (IREC). Retrieved 2010-07-24.
  21. U.S. Energy Information Administration. "Table CT2. Primary Energy Consumption Estimates, 1960-2015, Pennsylvania (Trillion BTU)". U.S. Department of Energy. Archived from the original on 2017-02-16. Retrieved 10 Oct 2017.
  22. "Pennsylvania". Solar Energy Industries Association. Retrieved 5 May 2020.
  23. Solar Industry Research Data
  24. "Pennsylvania - Net Generation for All Sectors". U.S. Energy Information Administration. Retrieved 2021-04-17.
  25. "What's the Difference between Installed Capacity and Electricity Generation?". Energy.gov. Retrieved 2021-10-03.
  26. "» Installed Capacity" . Retrieved 2021-10-03.
  27. Gagnon, Pieter; Margolis, Robert; Melius, Jennifer; Phillips, Caleb; Elmore, Ryan (Jan 2016). "Rooftop Solar Photovoltaic Technical Potential in the United States: A Detailed Assessment" (PDF). National Renewable Energy Laboratory. Retrieved 10 Oct 2017.
  28. 1 2 Siler-Evans, Kyle; Azevedo, Inês Lima; Morgan, M. Granger; Apt, Jay (2013-07-16). "Regional variations in the health, environmental, and climate benefits of wind and solar generation". Proceedings of the National Academy of Sciences. 110 (29): 11768–11773. Bibcode:2013PNAS..11011768S. doi: 10.1073/pnas.1221978110 . ISSN   0027-8424. PMC   3718187 . PMID   23798431.
  29. Shirley, Jessica; Althoff, Jr., David; Campbell, Kerry; Bristow, Geoff; Dinda, Walt (2017). "Finding Pennsylvania's Solar Future" (PDF). Pennsylvania Department of Environmental Protection. Retrieved 10 Oct 2017.
  30. Pennsylvania Department of Environmental Protection (2018). "Finding Pennsylvania's Solar Future". PA DEP. Retrieved 10 Oct 2017.
  31. Misbrener, Kelsey (2022-02-16). "Sheetz invests in enough solar to power nearly 70% of Pennsylvania facilities". Solar Power World. Retrieved 2022-04-03.