Renewable energy in Spain

Last updated

Renewable Energy in Spain [1]
Flag of Spain.svg
Renewable Energy (RE)
RE as % of Gross Final Energy Consumption.21.2% (2020)
NREAP target for above:20.0% (2020)
Renewable Electricity
Percentage electricity generated by RE.46.7% (2021)
RE generated / Total electricity generation.111,459/266,867 GWh Net(2014) [2]
Record % RE covered electricity consumption70.4% (21/11/15 wind only) [3]
Installed capacity (2020)
Wind Power26.7 GW
Bio Energy1 GW
Solar Power12.5 GW
Hydro Power20.0 GW
Geothermal0 GW
Total renewable60.2 GW

Spain, along with other European Union States, has a target of generating 32% of all its energy needs from renewable energy sources by 2030. [4] A previous target of 20% for 2020, [5] with an additional 0.8% available for other EU countries under the cooperation mechanism, was reached and slightly surpassed. [6] [7] [8] In 2021, renewables generated 46.7% of Spain's electricity needs, the largest part of it from wind power (23.3%), followed by hydroelectric (11.4%), solar (9.9%), and other renewables (2.2%). [9] [10] In 2023, the share of electricity generated from renewable sources rose to 50.8%, reflecting the country's progress towards its decarbonisation goals. [11]

Contents

Development

Andasol is the first parabolic trough power plant in Europe, and Andasol 1 went online in March 2009. Because of the high altitude (1,100 m) and the semi-arid climate, the site has exceptionally high annual direct insolation of 2,200 kWh/m per year. Andasol Solar Power Station 2.jpg
Andasol is the first parabolic trough power plant in Europe, and Andasol 1 went online in March 2009. Because of the high altitude (1,100 m) and the semi-arid climate, the site has exceptionally high annual direct insolation of 2,200 kWh/m per year.
PS10 solar power plant PS10 solar power tower.jpg
PS10 solar power plant

In 2019, the contribution of renewable energy sources to electricity generation was significant, comprising 101.1 Terawatt-hours (TWh) or 37.3% of the overall electricity production. The distribution of this contribution across different types of renewable energy was as follows: wind power led with 55.7 TWh, followed by hydroelectric power at 24.7 TWh, solar energy at 15.1 TWh, and bioenergy at 5.6 TWh.  This is comparable to the International Energy Agency (IEA) median for 2019, which stood at 38% of electricity generation from renewables. [12]

In the early 2000s, the growth of wind power contributed to an increase in Spain's renewable electricity production. By 2019, wind and solar energy made up 21% and 6% of total electricity generation, respectively. The installation of photovoltaic (PV) plants beginning in 2007 played a key role in this increase, doubling the renewables' share in Spain's electricity mix from 20% in 2008 to 40% in 2013. After this period of growth, the share of renewables in Spain's electricity generation leveled off, reaching 37% by 2019. [12]

Spain's renewable energy sector has undergone significant shifts, initially driven by the 1997 Special Regime and Royal Decree 661/2007, which promoted considerable growth in wind and solar PV installations through favorable conditions and feed-in tariffs. However, the dynamics of the sector shifted following legislative reforms in 2012, marked by the enactment of Law 24/2013 and Royal Decree 413/2014. These reforms introduced a new financial framework for the electricity market, modifying compensation mechanisms for renewable sources, which led to a deceleration in new developments. Consequently, the rapid increase in renewable capacity, notably in wind energy, from 2.2 GW in 2000 to 23.0 GW in 2013, slowed, with only a slight rise to 23.4 GW by 2018. Solar PV installations experienced a similar trend. [12]

In 2015 solar power suddenly demonstrated a possible way through the impasse. The continued fall in prices for solar systems and Spain's abundant sunshine led to prices for solar power reaching grid price parity. Suddenly there was the potential for sustained and spontaneous growth in solar installations in Spain as households and producers could produce power more economically. However, the Spanish government introduced what has been dubbed the world's first "sun tax" on solar installations making them economically less viable as well as draconian fines (up to 60 million Euros) for anyone not complying with the tax.[ citation needed ]

The tax has proved highly controversial. On the one hand, the government has argued that those generating their own power still rely on the national grid for power backup and so should be liable for contributing to the cost. On the other hand, the solar industry has argued that the government is simply trying to protect the centralised established power producers whose revenues would be threatened by this competitive solar threat. Environmentalists have criticised the tax for artificially blocking Spain from continuing its long standing movement to renewable energy production.[ citation needed ]

Whatever the merits of both arguments, the controversy can only become more heightened as the price of solar energy continues to fall and if PV solar power installed capacity in Spain were to continue sliding down the EU league from 12th position in 2014 (102.9 kW per 1000 inhabitants). In the same year in terms of wind energy production Spain was much stronger in 3rd position (495 kW per 1000 inhabitants).[ citation needed ]

In November 2018 the Government of Pedro Sánchez took the first step repealing the so-called 'sun tax', approved by the previous Government of Mariano Rajoy in 2015. With the new regulation, Spain leaves behind the era of punishment for self-consumption energy production which froze solar power and renewable energy development for many years in the face of EU and national controversy. [13] A new chapter of opportunity is finally returning to the renewable energy sector in Spain.

Spain is advancing Europe's energy autonomy with Iberdrola's renewable energy projects, supported by a €1 billion loan from the European Investment Bank in a deal signed in June 2023. Iberdrola plans to build 19 solar photovoltaic power plants and three onshore wind farms in Spain, Portugal, and Germany, with a total capacity of nearly 2.2 gigawatts. These projects aim to generate 4 terawatt-hours of electricity, equal to the annual consumption of over 1 million households. Importantly, 70% of these installations will be in rural areas affected by the transition to net-zero emissions, fostering regional development. To ensure a stable power supply, Iberdrola will integrate hybrid battery systems into its photovoltaic projects. These plants are expected to be operational by the end of 2028, aligning with the European Commission's REPowerEU plan to reduce fossil fuel imports and accelerate the green transition. [14]

Energy consumption by sector

Projected total gross final energy consumption by sector in 2020 (calculated as per NREAP criteria.)

  Heating and cooling (32.5%)
  Electricity (33.6%)
  Transport (33.9%)

All EU countries as well as Iceland and Norway submitted National Renewable Energy Action Plans (NREAPs) [15] to outline the steps taken, and projected progress by each country between 2010 and 2020 to meet the Renewable Energy Directive. Each plan contains a detailed breakdown of each country's current renewable energy usage and plans for future developments. According to projections by the updated Spanish submission dated 20/12/11 by 2020 the gross final energy consumption in Spain by sector breaks down as follows.

Projected energy use by sector in 2020 [6] ktoeRE 2020 targetRE 2020 consumption [16]
Heating and cooling30,92917.3%18%
Electricity31,96139.0%42.9%
Transport32.30111.3%9.5%
Gross final energy consumption*98.69320.0%21.2%
  • Including losses and adjustments

According to NREAP criteria around a third of energy consumption (32.5%) is used in the heating and cooling sector. The heating and cooling sector (also known as the thermal sector) includes domestic heating and air conditioning, industrial processes such as furnaces and any use of heat generally. The electricity sector and transport sector are also projected to account for around a third of energy consumption each at 33.6% and 33.9% respectively. The proportion of energy use in each sector is similar to that of 2016. In order to meet Spain's overall target for 20% use of renewable energy (it was just 8.3% in 2005) in gross final energy consumption (20,505 ktoe) by 2020 targets have been set for each sector as follows: 17.3% renewable energy use in the heating and cooling sector, 39% in the electricity sector and 11.3% in the transport sector. [17] Total annual energy consumption is projected to be 98,693 ktoe (98.7 million tonnes of oil equivalent) by 2020. The report expected Spain to produce a surplus of 0.8% above the 20% target (20.8% total) for renewable energy use which would be available for other countries to meet their renewable energy targets under the "cooperation mechanism".

The energy measures above are gross final energy consumption. Another broader measure, primary energy consumption also includes energy used in the extraction of fuels (the energy sector) and energy lost in transformation (the transformation sector, i.e. converting heat to electricity in power plants or fuel energy to heat in heating plants) as well as gross final energy consumption for end users. Under the European Union Energy Efficiency Directive EU countries submit their Energy Efficiency Plans every three years and Energy Efficiency Annual Reports every year. According to Spain's 2016 Energy Efficiency Annual Report the country's total final energy consumption in 2014 was 79.2 Mtoes whilst its primary energy consumption was 112.6 Mtoes. [18] Most of the approximately 42% difference is accounted for in losses in the transformation sector. These losses are likely to be most prevalent in thermal electricity sectors, thus the use of renewable electricity will reduce CO2 emissions and fuels lost in the energy and transformation sectors as well as those in final consumption. By using more efficient thermal generation the potential remains to reduce energy wastage by almost a third and to cut CO2 emissions accordingly.

Electricity Sector

Components of renewable electricity coverage in Spain 2015. Donut chart spain.png
Components of renewable electricity coverage in Spain 2015.

In 2015, wind power provided the largest share at 19.1% followed by hydroelectric power at 11.1%. Solar power provided 5.2% and renewable thermal a further 2%. The total electricity supplied (demand coverage) from renewables was 37.4% of Spain's requirements in 2015. The current generational mix of electricity production can be checked in real time on the Red Electrica de Espana website. [20]

Sharp variation from one year to the next is largely due to the substantial differences in hydroelectric production from one year to the next. Excluding hydroelectric production electricity generation from renewable energy sources grew from around 10 percent [21] in 2006 to 26.3 percent of demand coverage in 2015. Most of the growth occurred in the years leading up to 2012 with little change in baseline capacity between 2012 and 2015. Renewable energy generated electricity had a record year in 2014 when it supplied 42.8% of Spain's national demand.

Total annual net generation from renewable sources has grown from around 60 TWh in 2007 to close to 100-110 TWh in the years 2013–2015. Wind power overtook hydroelectric power as the largest source of renewable electricity from around 2008 onwards to produce around 50 TWh from 2013 onwards. Hydroelectric power remains to second largest source typically generating between 25 and 45 TWh per year depending on whether the year is a wet or dry one. Solar PV power grew from just 484 GWh in 2007 to 8,202 GWh by 2012 and has remained at a similar level through to 2015. Solar thermal power grew from almost no presence at 8 GWh in 2007 to 5,085 GWh by 2015. Renewable thermal and other sources have grown from around 2,589 GWh in 2007 to 4,625 GWh in 2015. Total electricity generation from all sources has fallen in Spain from 288 TWh in 2007 to 267 TWh by 2015, a fall of around 7%.

Electricity coverage by renewables (%) [19] [22] [23] [24]

Heating and cooling sector

Renewable energy in the heating and cooling sector, final energy consumption 2014 [1]
SourcektoeEstimated share of total

sector (all sources)

Biomass3,86213.65%
of which: -solid biomass3,76113.29%
-biogas1010.36%
-bio liquids00%
RE from heat pumps3321.17%
Solar Energy2590.92%
Geothermal190.07%
Total4,47115.80%
Overall share of energy use in the heating and cooling sector from renewable sources [1]
Year2011201220132014201520162017201820192020
Percentage of total sector13.5%14.0%14.0%15.6%16.9%15.9%16.2%16.1%17.2%18.0%

Every two years all EU countries as well as Iceland and Norway submit Progress Reports outlining their renewable energy development and movement towards meeting their 2020 renewable energy targets. According to the Spanish progress reports between 2011 and 2014 renewable energy share in the heating and cooling sector grew from 13.6% to 15.8%. In 2014 biomass provided the largest share of RE in the heating and cooling sector at approximately 13.65% of the total, equating to 3.862 million tonnes of oil equivalent. RE from heat pumps provided a little over 1% of the total sector, solar and geothermal power provided a contribution of 0.92% and 0.07% respectively.

Transport sector

Renewable energy in the transport sector, 2014 [1]
Confirmed renewable

sources

ktoe
Renewable electricity119
Hydrogen0
Total (Confirmed)119.7
*Unconfirmed renewable

biofuels sources

ktoe
Biodiesels536
Bioethanol186
HVO (hydro treated vegetable oil)289
Total (Unconfirmed)1,010

According to the third Spanish submission of EU country Progress Reports covering the years 2013 and 2014 renewable energy use in the transport sector in Spain and Brazil included renewable electricity accounting for energy use of 119.7 k toe. *The bio fuels listed in the report and the table above had not been confirmed as coming from sustainable sources and were awaiting assessment and possible confirmation and as such are not yet able to be confirmed as renewable energy sources. They are included for information about the sector. The total energy from bio fuels were 1,010 k toe in 2014. Renewable electricity accounted for 0.5% of the total fuel use in the transport sector (using 2020 EU target criteria). A rough calculation would imply that if the bio fuels are finally confirmed as renewable sources then the total renewable energy use in the transport sector would come to approximately 4.7% of the total in 2014.

Sources

Wind power

In 2014 Spain was the world's fourth biggest producer of wind power. In that year, the year-end installed capacity was 23 GW and the annual production was 51,439 GWh, a share of total electricity consumption of 21.1%. [25] Installed capacity grew from around 0.8GW in 1998 to approximately 23 GW by 2012. As can be seen from the graph, virtually no new wind power has been installed from 2012 to 2017.

Wind power installed capacity (MW) [26]

Hydroelectric Power

Installed capacity of hydroelectric power has grown by small incremental amounts annually since 2006 from 18,1815 MW in 2006 to 19,468 MW in 2014. Between 2014 and 2015 there was a significant growth in pumped storage generation of 850 MW. Total capacity reached 20,336 MW in 2015.

Hydroelectric installed capacity (MW) [26]

Annual electricity generation from hydroelectric sources varies considerably from year to year. A rough calculation shows that the contribution to total net generation varied approximately between 9-17 percent annually. This variation helps explain the fluctuating annual figures for total renewable energy in Spain. Production in 2012 was a little over half that of 2010 at just 24,100 gW/h.

Solar power

In 2005 Spain became the first country in Europe to require the installation of photovoltaic electricity generation in new buildings, and the second in the world (after Israel) to require the installation of solar hot water systems. [27] With the construction of the PS10, located near Seville, Spain became the first country to ever have a commercial solar energy power tower. [28] In recent years there has been much controversy over a tax on PV power generation as the cost of PV solar installations has reached grid parity in Spain according to several sources. Solar power first began to be installed significantly in 2006 with 136 MW installed capacity before rising rapidly to 6,949 MW by 2013. Little change in installed capacity occurred between 2013 and 2018, but between 2019 and 2022 Spain doubled its capacity.


Solar power installed capacity (MW) [26]

Renewable Thermal

In 2014 biomass and biogas contributed to around 2% of electricity generation in Spain as well as 13.65% of heat consumed in the heating and cooling sector. In terms of the energy provided to each sector in ktoe (thousand tonnes of oil equivalent), the fuels provided over nine times more energy to the heating and cooling sector.

Renewable thermal installed capacity (MW) [26]

Production by region

Production by source and Autonomous Community:

The following two tables show a snapshot of the generation of electricity from renewable sources in Spain at the end of 2006 and the end of 2013. In 2006 two regions were generating around 70 percent of electricity demand from renewables. By 2013 four regions were generating more electricity from renewables than the total demand within each region. The leading region was Castile and León which generated 164 percent of its total electricity demand.

Renewable Electricity in Spain (GWh, 2006 data) [29]
Autonomous Community Hydroelectric power (Nationwide)Wind powerSolar power - allBiomass

power

Solid waste

power

Total Renewable GenerationTotal Electricity Demand % Renewable of Total

Electricity Demand

Castile and León 696038401427487111751579370.8%
Galicia 756159701242317140912027969.5%
La Rioja 1248971321027186055.2%
Aragón 30733342163864871188554.6%
Navarre 37922482826902924540154.1%
Extremadura 224401002245507644.2%
Castile-La Mancha 71039358993447861268637.7%
Asturias 1680357022140026581239121.5%
Cantabria 875001141927569316.3%
Catalonia 32233017772413849484987.9%
Andalusia 9461042572802721407376.7%
Basque Country 3363393553261059209345.1%
Valencia 1041266135501375276685.0%
Canary Islands 028800028893723.1%
Balearic Islands 050013313862352.2%
Murcia 6593612017683342.1%
Madrid 830858330479305981.6%
Ceuta & Melilla 0000223910.5%
SPAIN293012292497216719215641028382919.9%
Renewable Electricity in Spain (GWh, 2013 data) [30]
Autonomous Community Hydroelectric

power

Hydroelectric

power

(special regime)

Wind powerSolar

thermal

Solar

PV

All - Renewable ThermalTotal Renewable GenerationTotal Electricity Demand% Renewable of Total

Electricity Demand

Castilla y León 79556281268108481812229313586164.09%
Extremadura 28553801649111015058024586126.52%
Castilla-La Mancha 551491865767816972381231211745104.83%
Galicia 8226184494960205972018319538103.30%
Aragón 3594101348690309228100131019098.26%
Navarra 146627266502953044037472085.53%
La Rioja 1066810780130121394165584.23%
Asturias 191133111420166640511052738.48%
Andalucía 13033316987198815861764139593728037.44%
Cantabria 6112797502821049446223.51%
Cataluña 4607109931957443125996654712220.51%
Región de Murcia 765654443802581579780120.24%
Comunidad Valenciana 1584252595105645348312561518.86%
Canarias 033640287866286257.68%
País Vasco 3751683560281871114173166.43%
Baleares 0060122112956742.27%
Comunidad de Madrid 691000092286547301691.81%
Ceuta y Melilla 00000.100.14120.02%
SPAIN3397071025470844428324507311361926102343.53%

Targets and progress

Targets

Renewable energy target trajectory NREAP report 20/12/11. [15]
200520102011201220132014201520162017201820192020
Renewable energy share of heating and cooling sector8.9%11.0%11.3%11.7%12.1%12.5%13.4%14.3%15.1%15.8%16.5%17.3%
Renewable energy share of electricity sector18.4%29.2%31.0%32.0%32.7%33.5%34.1%34.4%35.5%36.4%37.4%39.0%
Renewable energy share of transport sector0.8%5.0%7.1%7.6%7.8%8.0%8.3%8.7%9.1%9.6%10.2%11.3%
Renewable energy share of total energy consumption8.2%13.2%14.4%15.1%15.6%16.1%16.7%17.3%18.1%18.9%19.7%20.8%

The table above shows the expected trajectory for shares of renewable energy in the three sectors as well as the overall target trajectory. The information represents the Spanish submission as one of the European country National Renewable Energy Action Plans (NREAPS). Overall between 2005 and 2020 renewable energy sources are expected to rise from 8.2% of total energy use in 2005 to 20.8% of energy use by 2020.

Progress

Renewable energy Progress Report Spain, 2013–16. [1]
2013201420152016
Renewable energy share of heating and cooling sector14.1%15.8%16.8%16.8%
Renewable energy share of electricity sector36.7%37.8%36.9%36.6%
Renewable energy share of transport sector0.5%0.5%1.2%5.3%†
Renewable energy share of total energy consumption15.3%16.2%16.2%17.3%

† 2016 was the first year in which the contribution of biofuels was counted in the transport sector.

According to the third Spanish submission of EU country Progress Reports, (submitted every 2 years), covering the years 2013 and 2014, the country achieved renewable energy shares in each sector as listed in the table above. Spain has a 20.8% renewable energy target in its total energy in order to meet the European Union renewable energy targets for 2020. By 2014 Spain had achieved a 16.2% share of total energy use. Most of the growth occurred in the electricity sector which has grown from 18.4% of the total sector in 2005 to 37.8% by 2014.. During the same period the thermal sector registered a smaller rise from 8.9% to 15.8%. The transport sector remains well below its target trajectory at just 0.5% in 2014, although this may improve if Spanish biofuel use is confirmed as coming from sustainable sources to a level of roughly equal to 4.7% of the sector (see transport sector heading above). Spain's overall target for renewable energy use across all sectors stood at 16.2% of the total in 2014, just above its trajectory target and not a long way short of its 20.8% target for 2020.

See also

Related Research Articles

<span class="mw-page-title-main">Renewable energy in the European Union</span>

Renewable energy progress in the European Union (EU) is driven by the European Commission's 2023 revision of the Renewable Energy Directive, which raises the EU's binding renewable energy target for 2030 to at least 42.5%, up from the previous target of 32%. Effective since November 20, 2023, across all EU countries, this directive aligns with broader climate objectives, including reducing greenhouse gas emissions by at least 55% by 2030 and achieving climate neutrality by 2050. Additionally, the Energy 2020 strategy exceeded its goals, with the EU achieving a 22.1% share of renewable energy in 2020, surpassing the 20% target.

<span class="mw-page-title-main">Energy in the United Kingdom</span> Overview of the energy use of the United Kingdom

Energy in the United Kingdom came mostly from fossil fuels in 2021. Total energy consumption in the United Kingdom was 142.0 million tonnes of oil equivalent in 2019. In 2014, the UK had an energy consumption per capita of 2.78 tonnes of oil equivalent compared to a world average of 1.92 tonnes of oil equivalent. Demand for electricity in 2014 was 34.42 GW on average coming from a total electricity generation of 335.0 TWh.

<span class="mw-page-title-main">Renewable energy in Germany</span>

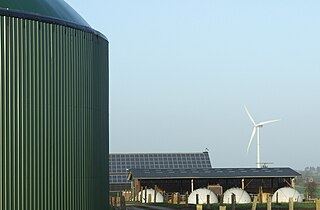
Renewable energy in Germany is mainly based on wind and biomass, plus solar and hydro. Germany had the world's largest photovoltaic installed capacity until 2014, and as of 2023 it has over 82 GW. It is also the world's third country by installed total wind power capacity, 64 GW in 2021 and second for offshore wind, with over 7 GW. Germany has been called "the world's first major renewable energy economy".

<span class="mw-page-title-main">Renewable energy in Portugal</span>

Renewable energy in Portugal was the source for 25.7% of total energy consumption in 2013. In 2014, 27% of Portugal's energy needs were supplied by renewable sources. In 2016, 28% of final energy consumption in Portugal came from renewable sources.

<span class="mw-page-title-main">Solar power in Spain</span>

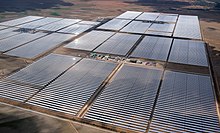
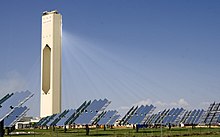
Spain is one of the first countries to deploy large-scale solar photovoltaics, and is the world leader in concentrated solar power (CSP) production.

<span class="mw-page-title-main">Wind power in Europe</span> Overview of wind power in Europe

As of 2023, Europe had a total installed wind capacity of 255 gigawatts (GW). In 2017, a total of 15,680 MW of wind power was installed, representing 55% of all new power capacity, and the wind power generated 336 TWh of electricity, enough to supply 11.6% of the EU's electricity consumption.

<span class="mw-page-title-main">Renewable energy in Finland</span> Overview of renewable energy in Finland

Renewable energy in Finland increased from 34% of the total final energy consumption (TFEC) in 2011 to 48% by the end of 2021, primarily driven by bioenergy (38%), hydroelectric power (6.1%), and wind energy (3.3%). In 2021, renewables covered 53% of heating and cooling, 39% of electricity generation, and 20% of the transport sector. By 2020, this growth positioned Finland as having the third highest share of renewables in TFEC among International Energy Agency (IEA) member countries.

Romania is the 38th largest energy consumer in the world and the largest in South Eastern Europe as well as an important producer of natural gas, oil and coal in Europe.

The electricity sector in Venezuela is heavily dependent on hydroelectricity, with this energy source accounting for 64% of the country's electricity generation in 2021.

<span class="mw-page-title-main">Electricity sector in France</span> Overview of the electricity sector in France

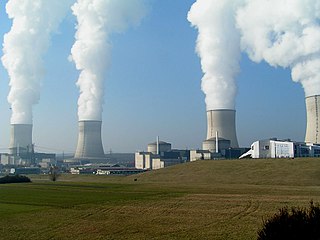
The electricity sector in France is dominated by its nuclear power, which accounted for 71.7% of total production in 2018, while renewables and fossil fuels accounted for 21.3% and 7.1%, respectively. France has the largest share of nuclear electricity in the world, and together with renewable energy supplies, this has helped its grid achieve very low carbon intensity.

<span class="mw-page-title-main">Energy in Sweden</span> Overview of energy use in Sweden

Energy in Sweden describes energy and electricity production, consumption and import in Sweden. Electricity sector in Sweden is the main article of electricity in Sweden. The Swedish climate bill of February 2017 aims to make Sweden carbon neutral by 2045. The Swedish target is to decline emission of climate gases 63% from 1990 to 2030 and international transportation excluding foreign flights 70%. By 2014 just over half of the country's total final energy consumption in electricity, heating and cooling and transport combined was provided by renewables, the highest share amongst the then 28 EU member countries. About a third of Sweden's electricity is generated by nuclear power. In generating a year's worth of this energy, Swedes generate about 4 tonnes of CO2 emissions each. Since 2010, sustainability measures have reduced total emissions even as the population has increased.

<span class="mw-page-title-main">Energy in Spain</span> Overview of the production, consumption, import and export of energy and electricity in Spain

Primary energy consumption in Spain in 2015 was mainly composed of fossil fuels. The largest sources are petroleum (42.3%), natural gas (19.8%) and coal (11.6%). The remaining 26.3% is accounted for by nuclear energy (12%) and different renewable energy sources (14.3%). Domestic production of primary energy includes nuclear (44,8%), solar, wind and geothermal (22,4%), biomass and waste (21,1%), hydropower (7,2%) and fossil (4,5%).

<span class="mw-page-title-main">Energy in Greece</span> Overview of the production, consumption, import and export of energy and electricity in Greece

Energy in Greece is dominated by fossil gas and oil. Electricity generation is dominated by the one third state owned Public Power Corporation. In 2009 DEI supplied for 85.6% of all electric energy demand in Greece, while the number fell to 77.3% in 2010. Almost half (48%) of DEI's power output in 2010 was generated using lignite. 12% of Greece's electricity comes from hydroelectric power plants and another 20% from natural gas. Between 2009 and 2010, independent companies' energy production increased by 56%, from 2,709 Gigawatt hour in 2009 to 4,232 GWh in 2010.

<span class="mw-page-title-main">Renewable energy in Italy</span>

Renewable energy has developed rapidly in Italy over the past decade and provided the country a means of diversifying from its historical dependency on imported fuels. Solar power accounted for around 8% of the total electric production in the country in 2014, making Italy the country with the highest contribution from solar energy in the world that year. Rapid growth in the deployment of solar, wind and bio energy in recent years lead to Italy producing over 40% of its electricity from renewable sources in 2014.

<span class="mw-page-title-main">Energy in Slovenia</span> Overview of the production, consumption, import and export of energy and electricity in Slovenia

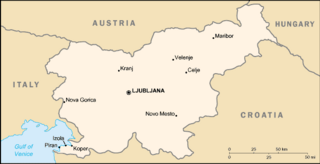
Total primary energy supply (TPES) in Slovenia was 6.80 Mtoe in 2019. In the same year, electricity production was 16.1 TWh, consumption was 14.9 TWh.

<span class="mw-page-title-main">Renewable energy in the Netherlands</span>

Despite the historic usage of wind power to drain water and grind grain, the Netherlands today lags 21 of the 26 other member states of the European Union in the consumption of energy from renewable sources. In 2022, the Netherlands consumed just 15% of its total energy from renewables. According to statistics published by Eurostat, it was the last among the EU countries in the shift away from global warming-inducing energy sources. The leading renewable sources in the country are biomass, wind, solar and both geothermal and aerothermal power. In 2018 decisions were made to replace natural gas as the main energy source in the Netherlands with increased electrification being a major part of this process.

Under its commitment to the EU renewable energy directive of 2009, France has a target of producing 23% of its total energy needs from renewable energy by 2020. This figure breaks down to renewable energy providing 33% of energy used in the heating and cooling sector, 27% of the electricity sector and 10.5% in the transport sector. By the end of 2014, 14.3% of France's total energy requirements came from renewable energy, a rise from 9.6% in 2005.

<span class="mw-page-title-main">Renewable energy in the Republic of Ireland</span>

Under the original 2009 Renewable Energy Directive Ireland had set a target of producing 16% of all its energy needs from renewable energy sources by 2020 but that has been updated by a second Renewable Energy Directive whose targets are 32% by 2030. Between 2005 and 2014 the percentage of energy from renewable energy sources grew from just 3.1% to 8.6% of total final consumption. By 2020 the overall renewable energy share was 13.5%, short of its Renewable Energy Drive target of 16%. Renewable electricity accounted for 69% of all renewable energy used in 2020, up from two thirds (66.8%) in 2019.

Myanmar had a total primary energy supply (TPES) of 16.57 Mtoe in 2013. Electricity consumption was 8.71 TWh. 65% of the primary energy supply consists of biomass energy, used almost exclusively (97%) in the residential sector. Myanmar’s energy consumption per capita is one of the lowest in Southeast Asia due to the low electrification rate and a widespread poverty. An estimated 65% of the population is not connected to the national grid. Energy consumption is growing rapidly, however, with an average annual growth rate of 3.3% from 2000 to 2007.

Denmark is a leading country in renewable energy production and usage. Renewable energy sources collectively produced 75% of Denmark's electricity generation in 2022, and are expected to provide 100% of national electric power production from 2030. Including energy use in the heating/cooling and transport sectors, Denmark is expected to reach 100% renewable energy in 2050, up from the 34% recorded in 2021.

References

  1. 1 2 3 4 5 "SHARES (Renewables) - Energy - Eurostat" . Retrieved 6 February 2022.
  2. "Elaborated data: Red Electrica De Espana, Publicaciones, Indicadores nacionales Data sheet for "Balances de energía eléctrica" March 2016 Accessed 5/5/16".
  3. "Red Electrica de Espana Corporate Responsibility Report 2015" (PDF).
  4. "Share of energy consumption from renewable sources in Europe". www.eea.europa.eu. 4 March 2022. Retrieved 26 August 2022.
  5. DIRECTIVE 2009/28/EC OF THE EUROPEAN PARLIAMENT AND OF THE COUNCIL, 23 April 2009 ,p31
  6. 1 2 "National Renewable Energy Action Plans, Directive 2009/28/EC". 29 June 2023.
  7. "Share of renewable energy in the EU up to 19.7% in 2019". ec.europa.eu. 18 December 2020. Retrieved 26 August 2022.
  8. "EU overachieves 2020 renewable energy target". ec.europa.eu. 19 January 2022. Retrieved 26 August 2022.
  9. "In 2021, Spain was the European country that generated the second highest amount of electricity with wind and solar power | Red Eléctrica". www.ree.es. Red Eléctrica de España. 30 June 2022. Retrieved 26 August 2022.
  10. Informe resumen de energías renovables 2021 (PDF) (Report) (in Spanish). Red Eléctrica de España. June 2022. Retrieved 26 August 2022.
  11. "Spain produced just over half of electricity from renewable sources in 2023". Reuters. 19 December 2023.
  12. 1 2 3 "Spain 2021 - Energy Policy Review" (PDF). International Energy Agency (IEA). 2021.
  13. Valdivia, Ana Garcia. "Renewable Energy In Spain: From The 'Sun Tax' To The Promotion Of Collective Self-Consumption". Forbes. Retrieved 25 June 2019.
  14. "Spain renewables projects strengthen Europe energy autonomy". European Investment Bank. Retrieved 5 February 2024.
  15. 1 2 "National Action Plans, European Commission". 29 June 2023.
  16. "SHARES summary results 2020".
  17. "Spanish National Renewable Energy Action Plan, Directive 2009/28/EC". 29 June 2023.
  18. "European Commission, National Energy Efficiency Action Plans and Annual Reports". 29 June 2023.
  19. 1 2 Preliminary Report 2015, Red Electrica Espana
  20. current mix of electricity generation
  21. Annual Report 2007, Red Electrica de Espana, figure for wind power only, excludes very small contribution from other sources.
  22. Corporate Responsibility Report 2009, p91, Red Eléctrica Corporación
  23. Preliminary Report 2013, p12, Red Eléctrica de España
  24. Corporate Responsibility Report 2014, p61, Red Eléctrica de España
  25. The Spanish Electricity System Preliminary Report 2014 (PDF), Red Eléctrica de España (REE), 2014
  26. 1 2 3 4 "Series estadísticas nacionales". Red Eléctrica de España. Retrieved 18 April 2020.
  27. REN21: Renewables Global Status Report - Update 2006 Archived 18 July 2011 at the Wayback Machine
  28. "beyondfossilfuel.com".
  29. Red Eléctrica de España Annual Report 2006 Archived 30 October 2008 at the Wayback Machine
  30. Red Electrica de Espana, Annual Report 2013