This article needs to be updated. Please help update this article to reflect recent events or newly available information.(May 2023)
This article's lead sectionmay be too short to adequately summarize the key points. Please consider expanding the lead to provide an accessible overview of all important aspects of the article.(April 2023)
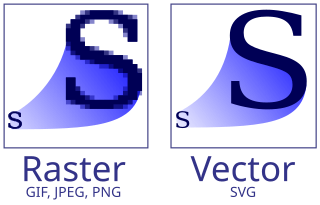
This image illustrates the difference between bitmap and vector images. The bitmap image is composed of a fixed set of pixels, while the vector image is composed of a fixed set of shapes. In the picture, scaling the bitmap reveals the pixels while scaling the vector image preserves the shapes.
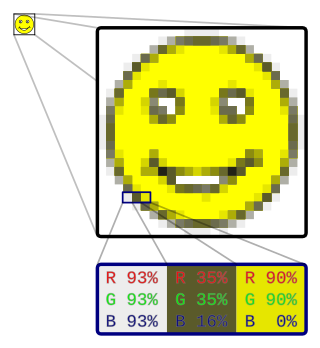
An image does not have any structure: it is just a collection of marks on paper, grains in film, or pixels in a bitmap. While such an image is useful, it has some limits. If the image is magnified enough, its artifacts appear. The halftone dots, film grains, and pixels become apparent. Images of sharp edges become fuzzy or jagged. See, for example, pixelation. Ideally, a vector image does not have the same problem. Edges and filled areas are represented as mathematical curves or gradients, and they can be magnified arbitrarily (though of course the final image must also be rasterized in to be rendered, and its quality depends on the quality of the rasterization algorithm for the given inputs).
The task in vectorization is to convert a two-dimensional image into a two-dimensional vector representation of the image. It is not examining the image and attempting to recognize or extract a three-dimensional model that may be depicted; i.e. it is not a vision system. For most applications, vectorization also does not involve optical character recognition; characters are treated as lines, curves, or filled objects without attaching any significance to them. In vectorization, the shape of the character is preserved, so artistic embellishments remain.
Vectorization is the inverse operation corresponding to rasterization, as integration is to differentiation. And, just as with these other two operations, while rasterization is fairly straightforward and algorithmic, vectorization involves the reconstruction of lost information and therefore requires heuristic methods.
Synthetic images such as maps, cartoons, logos, clip art, and technical drawings are suitable for vectorization. Those images could have been originally made as vector images because they are based on geometric shapes or drawn with simple curves.
Continuous tone photographs (such as live portraits) are not good candidates for vectorization.
The input to vectorization is an image, but an image may come in many forms such as a photograph, a drawing on paper, or one of several raster file formats. Programs that do raster-to-vector conversion may accept bitmap formats such as TIFF, BMP and PNG.
Vectorization can be used to update images or recover work. Personal computers often come with a simple paint program that produces a bitmap output file. These programs allow users to make simple illustrations by adding text, drawing outlines, and filling outlines with a specific color. Only the results of these operations (the pixels) are saved in the resulting bitmap; the drawing and filling operations are discarded. Vectorization can be used to recapture some of the information that was lost.
Vectorization is also used to recover information that was originally in a vector format but has been lost or has become unavailable. A company may have commissioned a logo from a graphic arts firm. Although the graphics firm used a vector format, the client company may not have received a copy of that format. The company may then acquire a vector format by scanning and vectorizing a paper copy of the logo.
Process
Original PNG file (16 kB)Hand converted to SVG (49 kB)
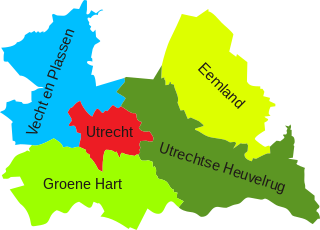
Vectorization starts with an image.
Manual
The image can be vectorized manually. A person could look at the image, make some measurements, and then write the output file by hand. That was the case for the vectorization of a technical illustration about neutrinos. The illustration has a few geometric shapes and a lot of text; it was relatively easy to convert the shapes, and the SVG vector format allows the text (even subscripts and superscripts) to be entered easily.
The original image did not have any curves (except for the text), so the conversion is straightforward. Curves make the conversion more complicated. Manual vectorization of complicated shapes can be facilitated by the tracing function built into some vector graphics editing programs.
If the image is not yet in machine readable form, then it has to be scanned into a usable file format.
Once there is a machine-readable bitmap, the image can be imported into a graphics editing program (such as Adobe Illustrator, CorelDRAW, or Inkscape). Then a person can manually trace the elements of the image using the program's editing features. Curves in the original image can be approximated with lines, arcs, and Bézier curves. An illustration program allows spline knots to be adjusted for a close fit. Manual vectorization is possible, but it can be tedious.
Although graphics drawing programs have been around for a long time, artists may find the freehand drawing facilities awkward even when a drawing tablet is used. Instead of using a program, Pepper recommends making an initial sketch on paper. Instead of scanning the sketch and tracing it freehand in the computer, Pepper states: "Those proficient with a graphic tablet and stylus could make the following changes directly in CorelDRAW by using a scan of the sketch as an underlay and drawing over it. I prefer to use pen and ink, and a light table"; most of the final image was traced by hand in ink. Later the line-drawing image was scanned at 600dpi, cleaned up in a paint program, and then automatically traced with a program.[1] Once the black and white image was in the graphics program, some other elements were added and the figure was colored.
Similarly, Ploch recreated a design from a digital photograph. The JPEG was imported and some "basic shapes" were traced by hand and colored in the graphics drawing program; more complex shapes were handled differently. Ploch used a bitmap editor to remove the background and crop the more complex image components. He then printed the image and traced it by hand onto tracing paper to get a clean black and white line drawing. That drawing was scanned and then vectorized with a program.[2]
Automatic
Some programs automate the vectorization process. Example programs are Adobe Streamline (discontinued), Corel's PowerTRACE, and Potrace. Some of these programs have a command line interface while others are interactive that allow the user to adjust the conversion settings and view the result. Adobe Streamline is not only an interactive program, but it also allows a user to manually edit the input bitmap and the output curves. Corel's PowerTRACE is accessed through CorelDRAW; CorelDRAW can be used to modify the input bitmap and edit the output curves. Adobe Illustrator has a facility to trace individual curves.[3]
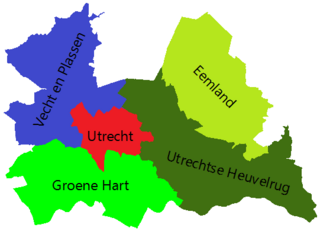
Automated programs can have mixed results. A program (PowerTRACE) was used to convert a PNG map to SVG. The program did a good job on the map boundaries (the most tedious task in the tracing) and the settings dropped out all the text (small objects). The text was manually re-inserted.
Map in PNG format (13 kB)Map after automated conversion and touch up to re-add the labels and adjust colors (18 kB)
Other conversions may not go as well. The results depend on having high-quality scans, reasonable settings, and good algorithms.
Scanned images often have a lot of noise. The bitmap image may need a lot of work to clean it up. Erase stray marks and fill in lines and areas.
Corel advice: Put the image on a light table, cover it with vellum (tracing paper), and then manually ink the desired outlines. Then scan the vellum and use an automated raster-to-vector conversion program on that scan.
Options
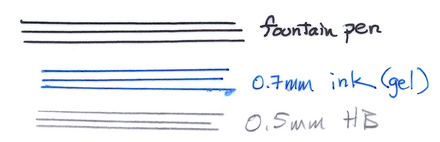
Although these lines may look solid, they are far from perfect. The lines were drawn on vellum with a fountain pen, a 0.7mm gel pen, and a 0.5mm HB pencil. The images were scanned at 600 pixels per inch with 24-bit RGB. The line widths end up being 10 to 14 pixels wide. The ink colors are not uniform and have specular reflections that put light pixels within the lines. The pencil lines also have interior defects due to the roughness (tooth) of the paper. The scan also has some unsharp masking artifacts.
There are many different image styles and possibilities, and no single vectorization method works well on all images. Consequently, vectorization programs have many options that influence the result.
One issue is what the predominant shapes are. If the image is of a fill-in form, then it will probably have just vertical and horizontal lines of a constant width. The program's vectorization should take that into account. On the other hand, a CAD drawing may have lines at any angle, there may be curved lines, and there may be several line weights (thick for objects and thin for dimension lines). Instead of (or in addition to) curves, the image may contain outlines filled with the same color. Adobe Streamline allows users to select a combination of line recognition (horizontal and vertical lines), centerline recognition, or outline recognition.[4] Streamline also allows small outline shapes to be thrown out; the notion is such small shapes are noise.[5] The user may set the noise level between 0 and 1000; an outline that has fewer pixels than that setting is discarded.
Another issue is the number of colors in the image. Even images that were created as black on white drawings may end up with many shades of gray. Some line-drawing routines employ anti-aliasing; a pixel completely covered by the line will be black, but a pixel that is only partially covered will be gray. If the original image is on paper and is scanned, there is a similar result: edge pixels will be gray. Sometimes images are compressed (e.g., JPEG images), and the compression will introduce gray levels.
Many of the vectorization programs will group same-color pixels into lines, curves, or outlined shapes. If each possible color is grouped into its object, there can be an enormous number of objects. Instead, the user is asked to select a finite number of colors (usually less than 256), the image is reduced to using that many colors (this step is color quantization), and then the vectorization is done on the reduced image.[6] For continuous tone images such as photographs, the result of color quantization is posterization. Gradient fills will also be posterized.[7]
Reducing the number of colors in an image is often aided by a histogram. The most common colors may be selected as the representatives, and other colors are mapped to their closest representative. When the number of colors is set to two, the user may be asked to make threshold and contrast settings.[8] A contrast setting looks for significant changes in pixel color rather than a particular color; consequently, it may ignore the gradual color variations in a gradient fill. Once the outline has been extracted, the user can manually reintroduce the gradient fill.
The vectorization program will want to group a region of the same color into a single object. It can do that by making the region boundary exactly follow the pixel boundaries, but the result will be a boundary of often short orthogonal lines. The resulting conversion will also have the same pixelation problems that a bitmap has when it is magnified. Instead, the vectorization program needs to approximate the region boundary with lines and curves that closely follow the pixel boundaries but are not exactly the pixel boundaries. A tolerance parameter tells the program how closely it should follow the pixel boundaries.[9]
The end result of many vectorization programs are curves consisting of cubic Bézier curves. A region boundary is approximated with several curve segments. To keep a curve smooth, the joints of two curves are constrained so the tangents match. One problem is determining where a curve bends so sharply that it should not be smooth.[10] The smooth portions of a curve are then approximated with a Bézier curve fitting procedure. Successive division may be used. Such a fitting procedure tries to fit the curve with a single cubic curve; if the fit is acceptable, then the procedure stops. Otherwise, it selects some advantageous point along the curve and breaks the curve into two parts. It then fits the parts while keeping the joint tangent. If the fit is still unacceptable, then it breaks the curve into more parts.[11]
Some vectorizers are standalone programs, but many have interactive interfaces that allow a user to adjust the program parameters and quickly see the result. PowerTRACE, for example, can display the original image and preview the converted image so the user may compare them; the program also reports information such as the number of curves.[12]
Example
Original artwork in PNG format; 115 kB.
Traced with PowerTRACE using detailed logo, smoothing 40, detail +2.5; result: 50 colors, 94 curves, 2452 nodes, 96 kB.
On the right is an illustration showing the operation of the radula in mollusks. The upper portion is mostly a one-pen-width filled outline diagram, but it has a mesh gradient fill along the bottom of the shell and along the bottom of the food. It also has some artistic brushes on the upper left of the shell. The bottom portion of the illustration has four line weights and some small characters; the color fill is simple except for a gradient at the jagged lines.
The 531×879 pixel image was traced; 50 colors were used. Most (if not all) lines were lost; they were turned into black regions, and their effective line widths varied. The black outline around the blue food in the upper part disappeared. The gradient fills and brushed spots were lost to color quantization/posterization; some brush spots disappeared. Some letters survived the vectorization with distortion, but most letters were discarded. Losing the letters is not a big issue; post conversion editing would want to delete the annotation and replace it with text rather than curves. Thin lines crossing at a shallow angle made filled regions, and intersecting outlines of filled regions became confused; see lower right corner. The tracing also has some odd features. Many black outlines touch, so they become large, complicated, objects rather than just outlines for specific regions. Instead of just a background, a rectangular white region separates the two outlined rectangles. The objects labeled op, rp, and rr are not simple layered shapes; the desired result would have rr overlaid by rp which is overlaid by op.
Usage domains
In computer-aided design (CAD) drawings (blueprints etc.) are scanned, vectorized, and written as CAD files in a process called paper-to-CAD conversion or drawing conversion.
Vectorized two-color (black & white) variant of the signature of Christopher Columbus, 19kB
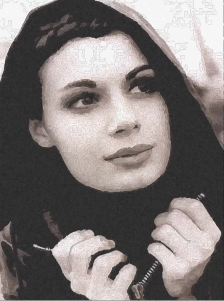
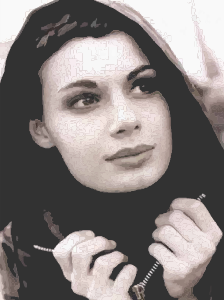
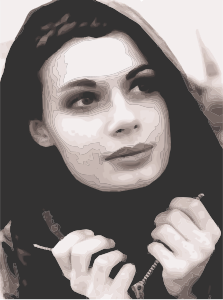
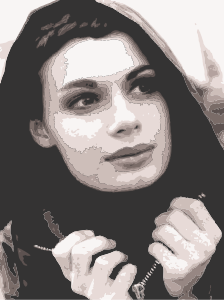
Continuous tone images
Vectorization is usually inappropriate for continuous tone images such as portraits. The result is often poor. For example, many different image tracing algorithms were applied to a 25kB JPEG image. The resulting vector images are at least a factor of ten larger and may have pronounced posterization effects when a small number of colors are used.
In computer graphics and digital photography, a raster graphic represents a two-dimensional picture as a rectangular matrix or grid of pixels, viewable via a computer display, paper, or other display medium. A raster is technically characterized by the width and height of the image in pixels and by the number of bits per pixel. Raster images are stored in image files with varying dissemination, production, generation, and acquisition formats.
Scalable Vector Graphics (SVG) is an XML-based vector image format for defining two-dimensional graphics, having support for interactivity and animation. The SVG specification is an open standard developed by the World Wide Web Consortium since 1999.
Vector graphics are a form of computer graphics in which visual images are created directly from geometric shapes defined on a Cartesian plane, such as points, lines, curves and polygons. The associated mechanisms may include vector display and printing hardware, vector data models and file formats, as well as the software based on these data models. Vector graphics is an alternative to raster or bitmap graphics, with each having advantages and disadvantages in specific situations.
A raster graphics editor is a computer program that allows users to create and edit images interactively on the computer screen and save them in one of many raster graphics file formats such as JPEG, PNG, and GIF.
In computer graphics, rasterisation or rasterization is the task of taking an image described in a vector graphics format (shapes) and converting it into a raster image. The rasterized image may then be displayed on a computer display, video display or printer, or stored in a bitmap file format. Rasterization may refer to the technique of drawing 3D models, or to the conversion of 2D rendering primitives, such as polygons and line segments, into a rasterized format.
A framebuffer is a portion of random-access memory (RAM) containing a bitmap that drives a video display. It is a memory buffer containing data representing all the pixels in a complete video frame. Modern video cards contain framebuffer circuitry in their cores. This circuitry converts an in-memory bitmap into a video signal that can be displayed on a computer monitor.
Adobe Illustrator is a vector graphics editor and design program developed and marketed by Adobe Inc. Originally designed for the Apple Macintosh, development of Adobe Illustrator began in 1985. Along with Creative Cloud, Illustrator CC was released. The latest version, Illustrator 2024, was released on October 10, 2023, and is the 28th generation in the product line. Adobe Illustrator was reviewed as the best vector graphics editing program in 2021 by hp
QuickDraw was the 2D graphics library and associated application programming interface (API) which is a core part of classic Mac OS. It was initially written by Bill Atkinson and Andy Hertzfeld. QuickDraw still existed as part of the libraries of macOS, but had been largely superseded by the more modern Quartz graphics system. In Mac OS X Tiger, QuickDraw has been officially deprecated. In Mac OS X Leopard applications using QuickDraw cannot make use of the added 64-bit support. In OS X Mountain Lion, QuickDraw header support was removed from the operating system. Applications using QuickDraw still ran under OS X Mountain Lion to macOS High Sierra; however, the current versions of Xcode and the macOS SDK do not contain the header files to compile such programmes.
Transparency in computer graphics is possible in a number of file formats. The term "transparency" is used in various ways by different people, but at its simplest there is "full transparency" i.e. something that is completely invisible. Only part of a graphic should be fully transparent, or there would be nothing to see. More complex is "partial transparency" or "translucency" where the effect is achieved that a graphic is partially transparent in the same way as colored glass. Since ultimately a printed page or computer or television screen can only be one color at a point, partial transparency is always simulated at some level by mixing colors. There are many different ways to mix colors, so in some cases transparency is ambiguous.
Corel Photo-Paint is a raster graphics editor developed and marketed by Corel since 1992. Corel markets the software for Windows and Mac OS operating systems, previously having marketed versions for Linux. Its primary market competitor is Adobe Photoshop.
A computer font is implemented as a digital data file containing a set of graphically related glyphs. A computer font is designed and created using a font editor. A computer font specifically designed for the computer screen, and not for printing, is a screen font.
Digital illustration or computer illustration is the use of digital tools to produce images under the direct manipulation of the artist, usually through a pointing device such as a graphics tablet or, less commonly, a mouse. It is distinguished from computer-generated art, which is produced by a computer using mathematical models created by the artist. It is also distinct from digital manipulation of photographs, in that it is an original construction "from scratch". Photographic elements such as background or texture may be incorporated into such works, but they are not necessarily the primary basis.
A number of vector graphics editors exist for various platforms. Potential users of these editors will make a comparison of vector graphics editors based on factors such as the availability for the user's platform, the software license, the feature set, the merits of the user interface (UI) and the focus of the program. Some programs are more suitable for artistic work while others are better for technical drawings. Another important factor is the application's support of various vector and bitmap image formats for import and export.
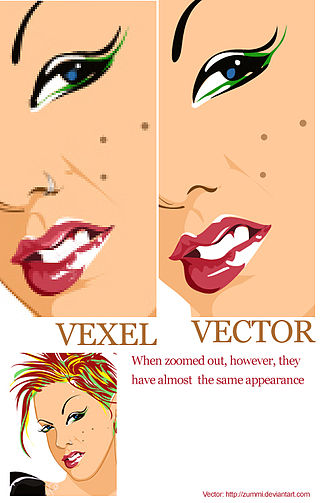
Vexel is a neologism for an entirely pixel-based form of raster art that imitates the visual appearance of vector graphics technique. The word itself is a portmanteau derived from a combination of "vector" and "pixel."
An image file format is a file format for a digital image. There are many formats that can be used, such as JPEG, PNG, and GIF. Most formats up until 2022 were for storing 2D images, not 3D ones. The data stored in an image file format may be compressed or uncompressed. If the data is compressed, it may be done so using lossy compression or lossless compression. For graphic design applications, vector formats are often used. Some image file formats support transparency.
Adobe Streamline is a discontinued line tracing program developed and published by Adobe Systems. Its primary purpose is to convert scanned bitmaps into vector artwork. Streamline is similar in function to competitors, such as Corel Trace, but was advertised as a standalone rather than an additional utility within a full drawing suite. Streamline was discontinued after Adobe Illustrator CS2 introduced a new tracing tool entitled Live Trace, which provides fast tracing, fine control, as well as a "live link" to the bitmap being traced. A test of the native Illustrator 9 auto-trace function by Creative Pro in 2002 concluded: "The premier tracing utility is StreamLine, which is infinitely controllable and very accurate."
In computing, a bitmap is a mapping from some domain to bits. It is also called a bit array or bitmap index.
Image editing encompasses the processes of altering images, whether they are digital photographs, traditional photo-chemical photographs, or illustrations. Traditional analog image editing is known as photo retouching, using tools such as an airbrush to modify photographs or editing illustrations with any traditional art medium. Graphic software programs, which can be broadly grouped into vector graphics editors, raster graphics editors, and 3D modelers, are the primary tools with which a user may manipulate, enhance, and transform images. Many image editing programs are also used to render or create computer art from scratch. The term "image editing" usually refers only to the editing of 2D images, not 3D ones.
This is a glossary of terms relating to computer graphics.
Boxy SVG is a vector graphics editor for creating illustrations, as well as logos, icons, and other elements of graphic design. It is primarily focused on editing drawings in the SVG file format. The program is available as both a web app and a desktop application for Windows, macOS, ChromeOS, and Linux-based operating systems.
Corel (2005), User Guide, CorelDRAW X3 Graphics Suite, Ottawa, ON: Corel Corporation, pp.213–220
Pepper, K. N. (2005), "Cartooning with CorelDRAW", in Corel (ed.), CorelDRAW Handbook: Insights from the Experts, CorelDRAW X3 Graphics Suite, Corel Corporation, pp.64–77
Ploch, Michael (2005), "Re-creating vintage designs on t-shirts", in Corel (ed.), CorelDRAW Handbook: Insights from the Experts, CorelDRAW X3 Graphics Suite, Corel Corporation, pp.12–23
Schneider, Philip J. (1990), "An Algorithm for Automatically Fitting Digitized Curves", in Glassner, Andrew S. (ed.), Graphics Gems, Boston, MA: Academic Press, pp.612–626, ISBN0-12-059756-X
This page is based on this Wikipedia article Text is available under the CC BY-SA 4.0 license; additional terms may apply. Images, videos and audio are available under their respective licenses.