Related Research Articles

The neutron is a subatomic particle, symbol
n
or
n0
, which has a neutral charge, and a mass slightly greater than that of a proton. Protons and neutrons constitute the nuclei of atoms. Since protons and neutrons behave similarly within the nucleus, they are both referred to as nucleons. Nucleons have a mass of approximately one atomic mass unit, or dalton, symbol Da. Their properties and interactions are described by nuclear physics. Protons and neutrons are not elementary particles; each is composed of three quarks.
A radionuclide (radioactive nuclide, radioisotope or radioactive isotope) is a nuclide that has excess numbers of either neutrons or protons, giving it excess nuclear energy, and making it unstable. This excess energy can be used in one of three ways: emitted from the nucleus as gamma radiation; transferred to one of its electrons to release it as a conversion electron; or used to create and emit a new particle (alpha particle or beta particle) from the nucleus. During those processes, the radionuclide is said to undergo radioactive decay. These emissions are considered ionizing radiation because they are energetic enough to liberate an electron from another atom. The radioactive decay can produce a stable nuclide or will sometimes produce a new unstable radionuclide which may undergo further decay. Radioactive decay is a random process at the level of single atoms: it is impossible to predict when one particular atom will decay. However, for a collection of atoms of a single nuclide the decay rate, and thus the half-life (t1/2) for that collection, can be calculated from their measured decay constants. The range of the half-lives of radioactive atoms has no known limits and spans a time range of over 55 orders of magnitude.

Stable nuclides are nuclides that are not radioactive and so do not spontaneously undergo radioactive decay. When such nuclides are referred to in relation to specific elements, they are usually termed stable isotopes.
A nuclide is a class of atoms characterized by their number of protons, Z, their number of neutrons, N, and their nuclear energy state.
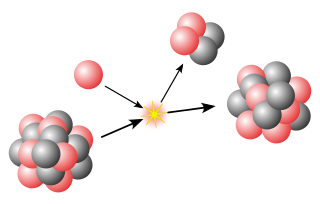
In nuclear engineering, fissile material is material that can undergo nuclear fission when struck by a neutron of low energy. A self-sustaining thermal chain reaction can only be achieved with fissile material. The predominant neutron energy in a system may be typified by either slow neutrons or fast neutrons. Fissile material can be used to fuel thermal-neutron reactors, fast-neutron reactors and nuclear explosives.
In nuclear science, the decay chain refers to a series of radioactive decays of different radioactive decay products as a sequential series of transformations. It is also known as a "radioactive cascade". The typical radioisotope does not decay directly to a stable state, but rather it decays to another radioisotope. Thus there is usually a series of decays until the atom has become a stable isotope, meaning that the nucleus of the atom has reached a stable state.
Positron emission, beta plus decay, or β+ decay is a subtype of radioactive decay called beta decay, in which a proton inside a radionuclide nucleus is converted into a neutron while releasing a positron and an electron neutrino. Positron emission is mediated by the weak force. The positron is a type of beta particle (β+), the other beta particle being the electron (β−) emitted from the β− decay of a nucleus.
Neutron emission is a mode of radioactive decay in which one or more neutrons are ejected from a nucleus. It occurs in the most neutron-rich/proton-deficient nuclides, and also from excited states of other nuclides as in photoneutron emission and beta-delayed neutron emission. As only a neutron is lost by this process the number of protons remains unchanged, and an atom does not become an atom of a different element, but a different isotope of the same element.
Naturally occurring lithium (3Li) is composed of two stable isotopes, lithium-6 and lithium-7, with the latter being far more abundant on Earth. Both of the natural isotopes have an unexpectedly low nuclear binding energy per nucleon when compared with the adjacent lighter and heavier elements, helium and beryllium. The longest-lived radioisotope of lithium is lithium-8, which has a half-life of just 838.7(3) milliseconds. Lithium-9 has a half-life of 178.2(4) ms, and lithium-11 has a half-life of 8.75(6) ms. All of the remaining isotopes of lithium have half-lives that are shorter than 10 nanoseconds. The shortest-lived known isotope of lithium is lithium-4, which decays by proton emission with a half-life of about 91(9) yoctoseconds, although the half-life of lithium-3 is yet to be determined, and is likely to be much shorter, like helium-2 (diproton) which undergoes proton emission within 10−9 s.
Technetium (43Tc) is one of the two elements with Z < 83 that have no stable isotopes; the other such element is promethium. It is primarily artificial, with only trace quantities existing in nature produced by spontaneous fission or neutron capture by molybdenum. The first isotopes to be synthesized were 97Tc and 99Tc in 1936, the first artificial element to be produced. The most stable radioisotopes are 97Tc, 98Tc, and 99Tc.
Natural nitrogen (7N) consists of two stable isotopes: the vast majority (99.6%) of naturally occurring nitrogen is nitrogen-14, with the remainder being nitrogen-15. Thirteen radioisotopes are also known, with atomic masses ranging from 9 to 23, along with three nuclear isomers. All of these radioisotopes are short-lived, the longest-lived being nitrogen-13 with a half-life of 9.965(4) min. All of the others have half-lives below 7.15 seconds, with most of these being below 620 milliseconds. Most of the isotopes with atomic mass numbers below 14 decay to isotopes of carbon, while most of the isotopes with masses above 15 decay to isotopes of oxygen. The shortest-lived known isotope is nitrogen-10, with a half-life of 143(36) yoctoseconds, though the half-life of nitrogen-9 has not been measured exactly.
Neptunium (93Np) is usually considered an artificial element, although trace quantities are found in nature, so a standard atomic weight cannot be given. Like all trace or artificial elements, it has no stable isotopes. The first isotope to be synthesized and identified was 239Np in 1940, produced by bombarding 238
U
with neutrons to produce 239
U
, which then underwent beta decay to 239
Np
.
A nucleogenic isotope, or nuclide, is one that is produced by a natural terrestrial nuclear reaction, other than a reaction beginning with cosmic rays. The nuclear reaction that produces nucleogenic nuclides is usually interaction with an alpha particle or the capture of fission or thermal neutrons. Some nucleogenic isotopes are stable and others are radioactive.
A table or chart of nuclides is a two-dimensional graph of isotopes of the elements, in which one axis represents the number of neutrons and the other represents the number of protons in the atomic nucleus. Each point plotted on the graph thus represents a nuclide of a known or hypothetical chemical element. This system of ordering nuclides can offer a greater insight into the characteristics of isotopes than the better-known periodic table, which shows only elements and not their isotopes. The chart of the nuclides is also known as the Segrè chart, after the Italian physicist Emilio Segrè.
In nuclear physics, the valley of stability is a characterization of the stability of nuclides to radioactivity based on their binding energy. Nuclides are composed of protons and neutrons. The shape of the valley refers to the profile of binding energy as a function of the numbers of neutrons and protons, with the lowest part of the valley corresponding to the region of most stable nuclei. The line of stable nuclides down the center of the valley of stability is known as the line of beta stability. The sides of the valley correspond to increasing instability to beta decay. The decay of a nuclide becomes more energetically favorable the further it is from the line of beta stability. The boundaries of the valley correspond to the nuclear drip lines, where nuclides become so unstable they emit single protons or single neutrons. Regions of instability within the valley at high atomic number also include radioactive decay by alpha radiation or spontaneous fission. The shape of the valley is roughly an elongated paraboloid corresponding to the nuclide binding energies as a function of neutron and atomic numbers.
Nuclear fission splits a heavy nucleus such as uranium or plutonium into two lighter nuclei, which are called fission products. Yield refers to the fraction of a fission product produced per fission.
Isotopes are distinct nuclear species of the same chemical element. They have the same atomic number and position in the periodic table, but differ in nucleon numbers due to different numbers of neutrons in their nuclei. While all isotopes of a given element have almost the same chemical properties, they have different atomic masses and physical properties.
Wilhem Walter Rudolph Max Seelmann-Eggebert was a German radiochemist. He was son of Erich Eggebert and Edwig Schmidt.
Nucleonica is a nuclear science web portal created by the European Commission's Joint Research Centre. which was later spun off to the company Nucleonica GmbH in March 2011.
References
- ↑ Zs. Sóti, J. Magill, R. Dreher: Karlsruhe Nuclide Chart – New 10th edition 2018, EPJ Nuclear Sci. Technol. Volume 5, 2019, https://doi.org/10.1051/epjn/2019004
- 1 2 3 J. Magill, R. Dreher, Zs. Sóti: Karlsruher Nuklidkarte / Chart of the Nuclides. 10th edition. Nucleonica GmbH, Karlsruhe 2018, ISBN 978-3-943868-51-7 (wall chart) or ISBN 978-3-943868-54-8 (fold-out chart), ISBN 978-3-943868-50-0 (accompanying booklet). Multilingual (German, English, French, Spanish, Russian and Chinese).
- 1 2 3 "Category:KNC". Homepage of the Karlsruhe Nuclide Chart in the Nucleonica wiki, with subpages. Nucleonica GmbH. Retrieved 26 February 2018.
- ↑ "Help:Karlsruhe Nuclide Chart Online, KNCO++". Description page of the online version of the Karlsruhe Nuclide Chart in the Nucleonica wiki. Nucleonica GmbH. Retrieved 26 February 2018.
- ↑ "Nuclidenkaart op gigaformaat". TU Delft. Retrieved 31 January 2024.