The economy of Malta is a highly industrialised service-based economy. It is classified as an advanced economy by the International Monetary Fund and is considered a high-income country by the World Bank and an innovation-driven economy by the World Economic Forum. It is a member of the European Union and of the eurozone, having formally adopted the euro on 1 January 2008.

The economy of Poland is an industrialised, mixed economy with a developed market that serves as the sixth-largest in the European Union by nominal GDP and fifth-largest by GDP (PPP). Poland boasts the extensive public services characteristic of most developed economies. Since 1988, Poland has pursued a policy of economic liberalisation but retained an advanced public welfare system. This includes universal free public healthcare and education, extensive provisions of free public childcare, and parental leave. The country is considered by many to be a successful post-communist state. It is classified as a high-income economy by the World Bank, ranking 20th worldwide in terms of GDP (PPP), 21st in terms of GDP (nominal), and 21st in the 2023 Economic Complexity Index.

The economy of Slovakia is based upon Slovakia becoming an EU member state in 2004, and adopting the euro at the beginning of 2009. Its capital, Bratislava, is the largest financial centre in Slovakia. As of Q1 2018, the unemployment rate was 5.72%.

The economy of Belgium is a highly developed, high-income, mixed economy.

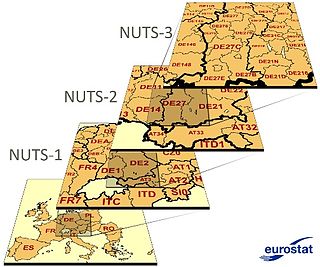
Nomenclature of Territorial Units for Statistics or NUTS is a geocode standard for referencing the administrative divisions of countries for statistical purposes. The standard, adopted in 2003, is developed and regulated by the European Union, and thus only covers the EU member states in detail. The Nomenclature of Territorial Units for Statistics is instrumental in the European Union's Structural Funds and Cohesion Fund delivery mechanisms and for locating the area where goods and services subject to European public procurement legislation are to be delivered.

The economy of the European Union is the joint economy of the member states of the European Union (EU). It is the second largest economy in the world in nominal terms, after the United States, and the third largest at purchasing power parity (PPP), after China and the US. The European Union's GDP is estimated to be $19.35 trillion (nominal) in 2024 or $26.64 trillion (PPP), representing around one-sixth of the global economy. Germany has the biggest national GDP of all EU countries, followed by France and Italy.

Ireland uses the Nomenclature of Territorial Units for Statistics (NUTS) geocode standard for referencing country subdivisions for statistical purposes. The standard is developed and regulated by the European Union. The NUTS standard is instrumental in delivering European Structural and Investment Funds. The NUTS code for Ireland is IE and a hierarchy of three levels is established by Eurostat. A further level of geographic organisation, the local administrative unit (LAU), in Ireland is the local electoral area.

Insular Italy is one of the five official statistical regions of Italy used by the National Institute of Statistics (ISTAT), a first level NUTS region and a European Parliament constituency. Insular Italy encompasses two of the country's 20 regions: Sardinia and Sicily.

Central Hungary is one of the seven statistical regions in Hungary. It includes Budapest and Pest County.

The South-West is a strategic planning area within the Southern Region in Ireland. It is a NUTS Level III statistical region of Ireland. It includes the city of Cork and the counties of Cork and Kerry. The South-West region spans 12,120 km2 (4,680 sq mi), roughly 16% of the total area of the state and according to the 2022 census has a population of 736,489.

The Nomenclature of Territorial Units for Statistics (NUTS) is developed by Eurostat, and employed in both Portugal and the entire European Union for statistical purposes. The NUTS branch extends from NUTS1, NUTS2 and NUTS3 regions, with the complementary LAU sub-categorization being used to differentiate the local areas, of trans-national importance.

The Mid-West is a strategic planning area within the Southern Region in Ireland. It is a NUTS Level III statistical region of Ireland. It consists of the counties of Clare and Tipperary, and the city and county of Limerick. Limerick City is the economic centre of the region. It spans 10,511 km2, 14.95% of the total area of the state and as of the 2022 census, it had a population of 505,369.

The Ionian Islands Region is the smallest by area of the thirteen administrative regions of Greece located in the Ionian Sea. It comprises all the Ionian Islands except Kythera, which, although historically part of the island group, was separated and integrated to the Attica Region.

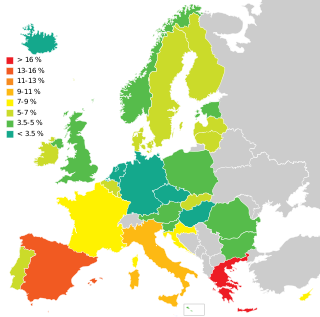
Unemployment in Poland appeared in the 19th century during industrialization, and was particularly severe during the Great Depression. Under communist rule Poland officially had close to full employment, although hidden unemployment existed. After Poland's transition to a market economy the unemployment rate sharply increased, peaking at above 16% in 1993, then dropped afterwards, but remained well above pre-1993 levels. Another period of high unemployment occurred in the early 2000s when the rate reached 20%. As Poland entered the European Union (EU) and its job market in 2004, the high unemployment set off a wave of emigration, and as a result domestic unemployment started a downward trend that continued until the onset of the 2008 Great Recession. Recent years have seen an increase in the unemployment rate from below 8% to above 10% (Eurostat) or from below 10% to 13% (GUS). The rate began dropping again in late 2013. Polish government (GUS) reported 9.6% registered unemployment in November 2015, while European Union's Eurostat gave 7.2%. According to Eurostat data, since 2008, unemployment in Poland has been constantly below the EU average. Significant regional differences in the unemployment rate exist across Poland.
Youth unemployment in Italy discusses the statistics, trends, causes and consequences of unemployment among young Italians. Italy displays one of the highest rates of youth unemployment among the 35 member countries of the Organization of Economic Co-Operation and Development (OECD). The Italian youth unemployment rate started raising dramatically since the 2008 financial crisis reaching its peak of 42.67% in 2014. In 2017, among the EU member states, the youth unemployment rate of Italy (35.1%) was exceeded by only Spain and Greece. The Italian youth unemployment rate was more than the double of the total EU average rate of 16.7% in 2017. While youth unemployment is extremely high compared to EU standards, the Italian total unemployment rate (11.1%) is closer to EU average (7.4%).


