The economy of Croatia is a developed social market economy. It is one of the largest economies in Southeast Europe by nominal gross domestic product (GDP). It is an open economy with accommodative foreign policy, highly dependent on international trade in Europe. Within Croatia, economic development varies among its counties, with strongest growth in Central Croatia and its financial centre, Zagreb. It has a very high level of human development, low levels of wealth inequality, and a high standard of living. Croatia's labor market has been perennially inefficient, with inconsistent business standards as well as ineffective corporate and income tax policy.

The economy of Mongolia has traditionally been based on agriculture and livestock. Mongolia also has extensive mineral deposits: copper, coal, molybdenum, tin, tungsten, and gold account for a large part of industrial production. Soviet assistance, at its height one-third of Gross domestic product (GDP), disappeared almost overnight in 1990–91, in the time of the collapse of the Soviet Union. Mongolia was driven into deep recession.

The economy of Pakistan is categorized as a developing economy. It ranks as the 24th-largest based on GDP using purchasing power parity (PPP) and the 46th largest in terms of nominal GDP. With a population of 241.5 million people as of 2023, Pakistan’s position at per capita income ranks 161st by GDP (nominal) and 138th by GDP (PPP) according to the International Monetary Fund (IMF).

The economy of Romania is a high-income mixed economy, with a high degree of complexity. It ranks 12th in the European Union by total nominal GDP and 7th largest when adjusted by purchasing power (PPP). The World Bank notes that Romania's efforts are focused on accelerating structural reforms and strengthening institutions in order to further converge with the European Union. The country's economic growth has been one of the highest in the EU since 2010, with 2022 seeing a better-than-expected 4.8% increase.

The economy of South Korea is a highly developed mixed economy. By nominal GDP, the economy was worth ₩2.24 quadrillion. It has the 4th largest economy in Asia and the 13th largest in the world. South Korea is notable for its rapid economic development from an underdeveloped nation to a developed, high-income country in a few generations. This economic growth has been described as the Miracle on the Han River, which has allowed it to join the OECD and the G20. It is included in the group of Next Eleven countries as having the potential to play a dominant role in the global economy by the middle of the 21st century. Among OECD members, South Korea has a highly efficient and strong social security system; social expenditure stood at roughly 15.5% of GDP. South Korea spends around 4.93% of GDP on advance research and development across various sectors of the economy.

The economy of Ukraine is an emerging, lower-middle income, mixed economy located in Eastern Europe. It grew rapidly from 2000 until 2008 when the Great Recession began worldwide and reached Ukraine. The economy recovered in 2010 and continued improving until 2013. From 2014 to 2015, the Ukrainian economy suffered a severe downturn, with GDP in 2015 being slightly above half of its value in 2013. In 2016, the economy again started to grow. By 2018, the Ukrainian economy was growing rapidly, and reached almost 80% of its size in 2008.
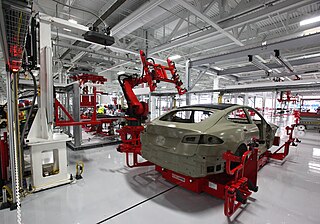
Manufacturing is the creation or production of goods with the help of equipment, labor, machines, tools, and chemical or biological processing or formulation. It is the essence of the secondary sector of the economy. The term may refer to a range of human activity, from handicraft to high-tech, but it is most commonly applied to industrial design, in which raw materials from the primary sector are transformed into finished goods on a large scale. Such goods may be sold to other manufacturers for the production of other more complex products, or distributed via the tertiary industry to end users and consumers.

The chemical industry comprises the companies and other organizations that develop and produce industrial, specialty and other chemicals. Central to the modern world economy, it converts raw materials into commodity chemicals for industrial and consumer products. It includes industries for petrochemicals such as polymers for plastics and synthetic fibers; inorganic chemicals such as acids and alkalis; agricultural chemicals such as fertilizers, pesticides and herbicides; and other categories such as industrial gases, speciality chemicals and pharmaceuticals.

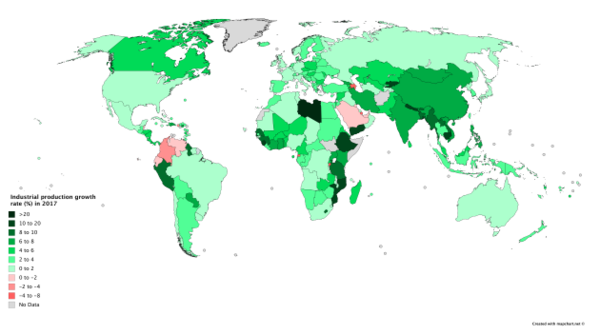
Economic growth can be defined as the increase or improvement in the inflation-adjusted market value of the goods and services produced by an economy in a financial year. Statisticians conventionally measure such growth as the percent rate of increase in the real and nominal gross domestic product (GDP).
Industrial fermentation is the intentional use of fermentation in manufacturing processes. In addition to the mass production of fermented foods and drinks, industrial fermentation has widespread applications in chemical industry. Commodity chemicals, such as acetic acid, citric acid, and ethanol are made by fermentation. Moreover, nearly all commercially produced industrial enzymes, such as lipase, invertase and rennet, are made by fermentation with genetically modified microbes. In some cases, production of biomass itself is the objective, as is the case for single-cell proteins, baker's yeast, and starter cultures for lactic acid bacteria used in cheesemaking.

The Japanese economic miracle refers to Japan's record period of economic growth between the post-World War II era and the end of the Cold War. During the economic boom, Japan rapidly became the world's second-largest economy. By the 1990s, Japan's population demographics had begun to stagnate, and the workforce was no longer expanding as quickly as it had in the previous decades despite per-worker productivity remaining high.

Hezuo city, also known as Zö from its Tibetan name, is the administrative seat of the Gannan Tibetan Autonomous Prefecture (TAP) in southern Gansu province in Northwestern China. It is home to the Gêndên Qöling and its Milaraiba Tower, the Langshangmaio Temple, and a mosque. There is a breed of pig, the Zoi Swine, from here and the whole Gannan TAP also.
The economic history of the Republic of Turkey had four eras or periods. The first era had the development policy emphasizing private accumulation between 1923 and 1929. The second era had the development policy emphasized state accumulation in a period of global crises between 1929 and 1945. The third era was state-guided industrialization based on import-substituting protectionism between 1950 and 1980. The final, era was the opening of the economy to liberal trade in goods, services and financial market transactions since 1981.

Industry is 39.4% of China's gross domestic product (GDP) in 2022. In 2007, industry contributed 46.7 percent of GDP in 2010 and occupied 27 percent of the workforce. In 2015, the manufacturing industrial sectors contributed to 40% of China's GDP. The manufacturing sector produced 44.1 percent of GDP in 2004 and accounted for 11.3 percent of total employment in 2006.

Manufacturing in Vietnam after reunification followed a pattern that was initially the reverse of the record in agriculture; it showed recovery from a depressed base in the early postwar years. However, this recovery stopped in the late 1970s as the war in Cambodia and the threat from China caused the government to redirect food, finance, and other resources to the military. This move worsened shortages and intensified old bottlenecks. At the same time, the invasion of Cambodia cost Vietnam urgent foreign economic support. China's attack on Vietnam in 1979 compounded industrial problems by damaging important industrial facilities in the North, particularly a major steel plant and an apatite mine.

The Mexican miracle is a term used to refer to the country's inward-looking development strategy that produced sustained economic growth. It is considered to be a golden age in Mexico's economy in which the Mexican economy grew 6.8% each year. It was a stabilizing economic plan which caused an average growth of 6.8% and industrial production to increase by 8% with inflation staying at only 2.5%. Beginning roughly in the 1940s, the Mexican government would begin to roll out the economic plan that they would call "the Mexican miracle," which would spark an economic boom beginning in 1954 spanning some 15 years and would last until 1970. In Mexico, the Spanish economic term used is "Desarrollo estabilizador" or "Stabilizing Development."
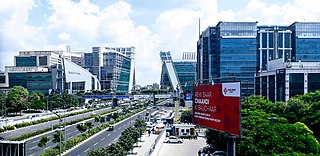
GSDP of Haryana state is estimated to be US$140 billion in 2023-2034 which had grown at 12.96% CAGR between 2012–17, boosted by the fact that this state on DMIC in NCR contributes 7% of India's agricultural exports and 60% of India's Basmati rice export, with 7 operational SEZs and additional 23 formally approved SEZs. Haryana also produces India's 67% of passenger cars, 60% of motorcycles, 50% of tractors and 50% of the refrigerators, which places Haryana on 14th place on the list of Indian states and union territories by GDP behind only much bigger states that are significantly larger in both area and population.
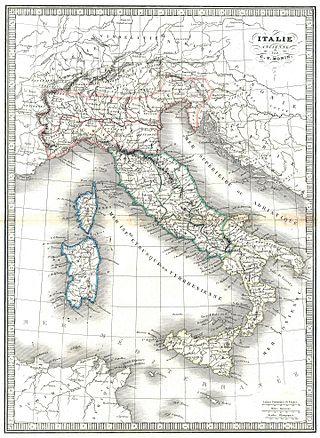
This is a history of the economy of Italy. For more information on historical, cultural, demographic and sociological developments in Italy, see the chronological era articles in the template to the right. For more information on specific political and governmental regimes in Italy, see the Kingdom and Fascist regime articles.

Industry of Croatia plays an important role in the country's economy. It has a longstanding tradition based since the 19th century on agriculture, forestry and mining. Many industrial branches developed at that time, like wood industry, food manufacturing, potash production, shipbuilding, leather and footwear production, textile industry, and others. Today, the industrial sectors in Croatia are food and beverage industry, metal processing and machine industry, including vehicles (20%), coke and refined petroleum production (17%), chemical, pharmaceutical, rubber and plastics industry (11%), wood, furniture and paper manufacturing (9%), electrical equipment, electronics and optics fabrication (9%), textile, clothing and footwear industry (5%) as well as construction and building materials production (5%).