List of regions of the United Kingdom by GRP

Last updated

This article lists the gross regional product (GRP) of regions of the United Kingdom, defined as Level 2 regions of the Nomenclature of Territorial Units for Statistics (NUTS 2), in nominal values. Values are shown in euros in the original source. For comparison, all figures are converted into pounds sterling and US dollars according to annual average exchange rates. [1] [n 1] All values are given in millions, and converted values are rounded to the nearest whole number.

Contents

Note that 2021 was an exceptional year because of the fall in GDP in 2020 which averaged 11.0% across the country. The recovery in 2021 was therefore a partial "bounce back" from this slump.

2021

List of regions of the United Kingdom by GDP [2]
RegionRankPopulationGDP (millions of GBP)GDP per head (GBP)Annual Growth Rate in 'Real' GDP (%)
Flag of the United Kingdom.svg  United Kingdom 67,026,3072,276,71533,7457.5
Flag of England.svg   London 18,796,628526,52459,8558.5 Increase2.svg
Flag of England.svg   South East 29,294,023336,20136,1748.2 Increase2.svg
Flag of England.svg   North West 37,422,294220,30429,6819.9 Increase2.svg
Flag of England.svg   East of England 46,398,497213,82833,4193.9 Increase2.svg
Flag of England.svg   South West 55,764,881194,03033,6574.2 Increase2.svg
Flag of Scotland.svg   Scotland 65,447,698186,85134,2993.8 Increase2.svg
Flag of England.svg   West Midlands 76,021,653181,35428,8413.2 Increase2.svg
Flag of England.svg   Yorkshire and the Humber 85,481,431151,79427,6929.8 Increase2.svg
Flag of England.svg   East Midlands 94,934,939146,48229,6831.8 Increase2.svg
Flag of Wales (1959-present).svg   Wales 103,131,64085,41227,2743.8 Increase2.svg
Flag of England.svg   North East 112,646,77265,04524,5759.4 Increase2.svg
Northern Ireland 121,904,57851,71727,1549.0 Increase2.svg

2018

List of regions of the United Kingdom by GRP [3]
RegionRankGRP (millions of EUR)GRP (millions of GBP)GRP (millions of USD)
Flag of the United Kingdom.svg United Kingdom2,423,7372,144,9612,862,460
Inner London – West1254,771225,467300,887
Inner London – East2137,068121,303161,879
Berkshire, Buckinghamshire and Oxfordshire 3120,073106,262141,808
Surrey, East and West Sussex 4106,12793,920125,337
Gloucestershire, Wiltshire and Bristol/Bath area593,00982,311109,845
Outer London – West and North West691,37980,869107,920
Greater Manchester 790,18279,809106,506
West Midlands 888,49078,312104,508
East Anglia 981,59972,21496,369
Eastern Scotland 1073,37764,93786,659
Bedfordshire and Hertfordshire 1173,21764,79686,470
Hampshire and Isle of Wight 1272,02263,73885,059
West Yorkshire 1370,29062,20583,013
Derbyshire and Nottinghamshire 1461,41454,35072,531
Leicestershire, Rutland and Northamptonshire 1557,93951,27568,427
Essex 1654,18347,95163,991
Kent 1753,86547,67063,615
Northern Ireland 1853,59147,42763,292
West Central Scotland 1948,00042,47956,689
Outer London – East and North East2047,53642,06856,141
Herefordshire, Worcestershire and Warwickshire 2146,97641,57355,479
West Wales and the Valleys 2245,24340,03953,432
Shropshire and Staffordshire 2344,10239,02952,085
Lancashire 2443,31538,33351,155
Merseyside 2542,67537,76750,400
Cheshire 2641,25036,50548,717
Outer London – South2741,05236,30048,483
Northumberland and Tyne and Wear 2840,71536,03248,085
Dorset and Somerset 2938,13533,74945,038
East Wales 3037,41433,11144,186
South Yorkshire 3134,69030,70040,969
Devon 3231,93828,26537,719
Tees Valley and Durham 3328,66025,36433,848
North Yorkshire 3426,30723,28131,069
East Yorkshire and Northern Lincolnshire 3525,68922,73430,339
North Eastern Scotland 3623,15720,49427,349
Southern Scotland 3720,47518,12024,181
Lincolnshire 3819,02216,83422,465
Highlands and Islands 3915,47113,69218,271
Cumbria 4015,17513,43017,922
Cornwall and Isles of Scilly 4113,91812,31716,437

See also

Notes

  1. Euro figures are converted to GBP and USD rates as of 31 December of a given year.

Related Research Articles

<span class="mw-page-title-main">Economy of the United Kingdom</span>

The economy of the United Kingdom is a highly developed social market economy. It is the sixth-largest national economy in the world measured by nominal gross domestic product (GDP), Tenth-largest by purchasing power parity (PPP), and twenty-first by nominal GDP per capita, constituting 3.1% of nominal world GDP. The United Kingdom constitutes 2.3% of world GDP by purchasing power parity (PPP).

<span class="mw-page-title-main">Financial and social rankings of sovereign states in Europe</span> Overview of financial and social rankings of the sovereign states in Europe

This page compares the sovereign states of Europe on economic, financial and social indicators.

<span class="mw-page-title-main">Economy of the European Union</span>

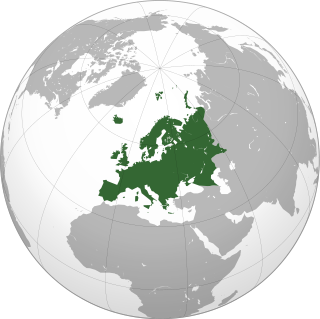
The economy of the European Union is the joint economy of the member states of the European Union (EU). It is the second largest economy in the world in nominal terms, after the United States, and the third largest at purchasing power parity (PPP), after China and the US. The European Union's GDP is estimated to be $19.35 trillion (nominal) in 2024 or $26.64 trillion (PPP), representing around one-sixth of the global economy. Germany has the biggest national GDP of all EU countries, followed by France and Italy. In 2022, the social welfare expenditure of the European Union (EU) as a whole was 19.5% of its GDP.

<span class="mw-page-title-main">Insular Italy</span> Statistical region of Italy

Insular Italy is one of the five official statistical regions of Italy used by the National Institute of Statistics (ISTAT), a first level NUTS region and a European Parliament constituency. Insular Italy encompasses two of the country's 20 regions: Sardinia and Sicily.

<span class="mw-page-title-main">North Region, Portugal</span> NUTS II Region in Portugal

The North Region or Northern Portugal is the most populous region in Portugal, ahead of Lisbon, and the third most extensive by area. The region has 3,576,205 inhabitants according to the 2017 census, and its area is 21,278 kilometres (13,222 mi) with a density of 173 inhabitants per square kilometre. It is one of five regions of Mainland Portugal. Its main population center is the urban area of Porto, with about one million inhabitants; it includes a larger political metropolitan region with 1.8 million, and an urban-metropolitan agglomeration with 2.99 million inhabitants, including Porto and neighboring cities, such as Braga, Guimarães and Póvoa de Varzim. The Commission of Regional Coordination of the North (CCDR-N) is the agency that coordinates environmental policies, land-use planning, cities and the overall development of this region, supporting local governments and associations.

<span class="mw-page-title-main">Lisbon Region</span> Region in Portugal

Lisbon Region is one of the seven NUTS II designated regions of Portugal, which coincides with the NUTS III subregion Lisbon Metropolitan Area. The region covers an area of 3001.95 km2 and includes a population of 2,815,851 inhabitants according to the 2011 census, a density of 1039 inhabitants/km2.

<span class="mw-page-title-main">South Italy</span> Regions of Italy

South Italy is one of the five official statistical regions of Italy used by the National Institute of Statistics (ISTAT), a first level NUTS region and a European Parliament constituency. South Italy encompasses six of the country's 20 regions:

<span class="mw-page-title-main">Alentejo Region</span> NUTS of Portugal

Alentejo Region is one of the seven NUTS 2 regions of Portugal. It covers all of the historical Alentejo Province and part of the historical Ribatejo and Estremadura provinces.

<span class="mw-page-title-main">Ionian Islands (region)</span> Administrative region of Greece

The Ionian Islands Region is the smallest by area of the thirteen administrative regions of Greece located in the Ionian Sea. It comprises all the Ionian Islands except Kythera, which, although historically part of the island group, was separated and integrated to the Attica Region.

References

  1. "Yearly Average Rates & Forex History Data". OFX. Retrieved 14 April 2020.
  2. {{ https://www.ons.gov.uk/economy/grossdomesticproductgdp/datasets/regionalgrossdomesticproductallnutslevelregions }}
  3. "Regional GDP per capita ranged from 30% to 263% of the EU average in 2018". ec.europa.eu. Retrieved 15 December 2020.