Natural gas is a naturally occurring mixture of gaseous hydrocarbons consisting primarily of methane (97%) in addition to various smaller amounts of other higher alkanes. Low levels of trace gases like carbon dioxide, nitrogen, hydrogen sulfide, and helium are also usually present. Methane is colorless and odorless, and the second largest greenhouse gas contributor to global climate change after carbon dioxide. Because natural gas is odorless, odorizers such as mercaptan are commonly added to it for safety so that leaks can be readily detected.

Petroleum or crude oil, also referred to as simply oil, is a naturally occurring yellowish-black liquid mixture of mainly hydrocarbons, and is found in geological formations. The name petroleum covers both naturally occurring unprocessed crude oil and petroleum products that consist of refined crude oil.

Peak oil is the theorized point in time when the maximum rate of global oil production will occur, after which oil production will begin an irreversible decline. The primary concern of peak oil is that global transportation heavily relies upon the use of gasoline and diesel fuel. Switching transportation to electric vehicles, biofuels, or more fuel-efficient forms of travel may help reduce oil demand.

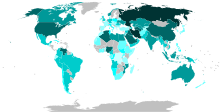
Iran possesses significant energy reserves, holding the position of the world's third-largest in proved oil reserves and the second-largest in natural gas reserves as of 2021. At the conclusion of the same year, Iran's share comprised 24% of the oil reserves in the Middle East and 12% of the worldwide total.
Peak gas is the point in time when the maximum global natural gas production rate will be reached, after which the rate of production will enter its terminal decline. Although demand is peaking in the United States and Europe, it continues to rise globally due to consumers in Asia, especially China. Natural gas is a fossil fuel formed from plant matter over the course of millions of years. Natural gas derived from fossil fuels is a non-renewable energy source; however, methane can be renewable in other forms such as biogas. Peak coal was in 2013, and peak oil is forecast to occur before peak gas. One forecast is for natural gas demand to peak in 2035.
There have been widely varying estimates of proven oil reserves in Russia. Most estimates included only Western Siberian reserves, which have been exploited since the 1970s and supply two-thirds of Russian oil. However, there are potentially huge reserves elsewhere. In 2005, the Russian Ministry of Natural Resources estimated that another 4.7 billion barrels of oil exist in Eastern Siberia. In July 2013, the Russian Natural Resources Ministry made official estimates of reserves available for the first time. According to Russian Natural Resources Minister Sergey Donskoy, as of 1 January 2012, recoverable reserves of oil in Russia under category ABC1 were 17.8 billion tons and category C2 reserves were 10.9 billion tons.

Within the petroleum industry, proven crude oil reserves in the United States were 44.4 billion barrels (7.06×10⁹ m3) of crude oil as of the end of 2021, excluding the Strategic Petroleum Reserve.

Gas depletion is the decline in natural gas production of a well, gas field, or geographic area.

This article describes the energy and electricity production, consumption and import in Egypt.
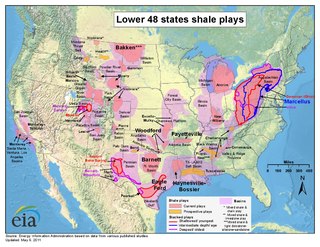
Shale gas in the United States is an available source of unconventional natural gas. Led by new applications of hydraulic fracturing technology and horizontal drilling, development of new sources of shale gas has offset declines in production from conventional gas reservoirs, and has led to major increases in reserves of U.S. natural gas. Largely due to shale gas discoveries, estimated reserves of natural gas in the United States in 2008 were 35% higher than in 2006.
Natural gas in Bolivia is one of the nation's main energy sources and export products. Bolivia's proved natural gas reserves are estimated to be 10.7 (TCF) .. Most of these reserves are located in the eastern region of the country. The major export pipelines in Bolivia transport the gas to Argentina and Brazil.

The inclusion of unconventional shale gas with conventional gas reserves has caused a sharp increase in estimated recoverable natural gas in Canada. Until the 1990s success of hydraulic fracturing in the Barnett Shales of north Texas, shale gas was classed as "unconventional reserves" and was considered too expensive to recover. There are a number of prospective shale gas deposits in various stages of exploration and exploitation across the country, from British Columbia to Nova Scotia.
Energy in Iraq plays a crucial role in both the national economy and the global energy markets due to the country's vast oil reserves and significant status within the Organization of the Petroleum Exporting Countries (OPEC).
Shale gas is an unconventional natural gas produced from shale, a type of sedimentary rock. Shale gas has become an increasingly important source of natural gas in the United States over the past decade, and interest has spread to potential gas shales in Canada, Europe, Asia, and Australia. One analyst expects shale gas to supply as much as half the natural gas production in North America by 2020.
Oil and Gas dominate the resource sector of the Republic of the Congo, also referred to as Congo-Brazzaville, with the petroleum industry accounting for 89% of the country's exports in 2010. As of June 22, 2018, is a full member of the Organization of the Petroleum Exporting Countries (OPEC), and among African crude oil producers in 2022, The Congo ranked sixth. Nearly all of the country's hydrocarbons were produced off-shore.

The Marcellus natural gas trend is a large geographic area of prolific shale gas extraction from the Marcellus Shale or Marcellus Formation, of Devonian age, in the eastern United States. The shale play encompasses 104,000 square miles and stretches across Pennsylvania and West Virginia, and into eastern Ohio and western New York. In 2012, it was the largest source of natural gas in the United States, and production was still growing rapidly in 2013. The natural gas is trapped in low-permeability shale, and requires the well completion method of hydraulic fracturing to allow the gas to flow to the well bore. The surge in drilling activity in the Marcellus Shale since 2008 has generated both economic benefits and considerable controversy.

Natural gas was the United States' largest source of energy production in 2016, representing 33 percent of all energy produced in the country. Natural gas has been the largest source of electrical generation in the United States since July 2015.
According to the United States Energy Information Administration (EIA), Pakistan may have over 9 billion barrels (1.4×10⁹ cubic metres) of petroleum oil and 105 trillion cubic feet (3.0 trillion cubic metres) in natural gas (including shale gas) reserves.