Gross domestic product (GDP) is a monetary measure of the market value of all the final goods and services produced in a specific time period by a country or countries. GDP is most often used by the government of a single country to measure its economic health. Due to its complex and subjective nature, this measure is often revised before being considered a reliable indicator.

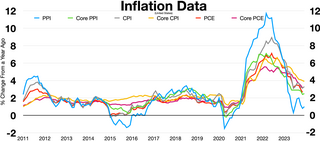
In economics, inflation is an increase in the general price level of goods and services in an economy. When the general price level rises, each unit of currency buys fewer goods and services; consequently, inflation corresponds to a reduction in the purchasing power of money. The opposite of inflation is deflation, a decrease in the general price level of goods and services. The common measure of inflation is the inflation rate, the annualized percentage change in a general price index. As prices faced by households do not all increase at the same rate, the consumer price index (CPI) is often used for this purpose. The employment cost index is also used for wages in the United States.
Purchasing power parity (PPP) is a measure of the price of specific goods in different countries and is used to compare the absolute purchasing power of the countries' currencies. PPP is effectively the ratio of the price of a basket of goods at one location divided by the price of the basket of goods at a different location. The PPP inflation and exchange rate may differ from the market exchange rate because of tariffs, and other transaction costs.
An economic indicator is a statistic about an economic activity. Economic indicators allow analysis of economic performance and predictions of future performance. One application of economic indicators is the study of business cycles. Economic indicators include various indices, earnings reports, and economic summaries: for example, the unemployment rate, quits rate, housing starts, consumer price index, Inverted yield curve, consumer leverage ratio, industrial production, bankruptcies, gross domestic product, broadband internet penetration, retail sales, price index, and money supply changes.

A consumer price index (CPI) is a price index, the price of a weighted average market basket of consumer goods and services purchased by households. Changes in measured CPI track changes in prices over time.
In economics, the GDP deflator is a measure of the money price of all new, domestically produced, final goods and services in an economy in a year relative to the real value of them. It can be used as a measure of the value of money. GDP stands for gross domestic product, the total monetary value of all final goods and services produced within the territory of a country over a particular period of time.
A market basket or commodity bundle is a fixed list of items, in given proportions. Its most common use is to track the progress of inflation in an economy or specific market. That is, to measure the changes in the value of money over time. A market basket is also used with the theory of purchasing price parity to measure the value of money in different places.
A cost-of-living index is a theoretical price index that measures relative cost of living over time or regions. It is an index that measures differences in the price of goods and services, and allows for substitutions with other items as prices vary.
Household final consumption expenditure (POES) is a transaction of the national account's use of income account representing consumer spending. It consists of the expenditure incurred by resident households on individual consumption goods and services, including those sold at prices that are not economically significant. It also includes various kinds of imputed expenditure of which the imputed rent for services of owner-occupied housing is generally the most important one. The household sector covers not only those living in traditional households, but also those people living in communal establishments, such as retirement homes, boarding houses and prisons.

The Producer Price Index (PPI) is the official measure of producer prices in the economy of the United States. It measures average changes in prices received by domestic producers for their output. The PPI was known as the Wholesale Price Index, or WPI, up to 1978. It is published by the Bureau of Labor Statistics and is one of the oldest economic time series compiled by the Federal government of the United States.
In the United Kingdom, the Retail Prices Index or Retail Price Index (RPI) is a measure of inflation published monthly by the Office for National Statistics. It measures the change in the cost of a representative sample of retail goods and services.
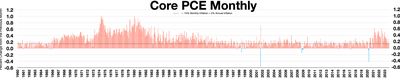
Core inflation represents the long run trend in the price level. In measuring long run inflation, transitory price changes should be excluded. One way of accomplishing this is by excluding items frequently subject to volatile prices, like food and energy.
The United States Consumer Price Index (CPI) is a set of consumer price indices calculated by the U.S. Bureau of Labor Statistics (BLS). To be precise, the BLS routinely computes many different CPIs that are used for different purposes. Each is a time series measure of the price of consumer goods and services. The BLS publishes the CPI monthly.
Chained dollars is a method of adjusting real dollar amounts for inflation over time, to allow the comparison of figures from different years. The U.S. Department of Commerce introduced the chained-dollar measure in 1996. It generally reflects dollar figures computed with 2012 as the base year.
Headline inflation is a measure of the total inflation within an economy, including commodities such as food and energy prices, which tend to be much more volatile and prone to inflationary spikes. On the other hand, "core inflation" is calculated from a consumer price index minus the volatile food and energy components. Headline inflation may not present an accurate picture of an economy's inflationary trend since sector-specific inflationary spikes are unlikely to persist.
The Higher Education Price Index (HEPI) is a measure of the inflation rate applicable to United States higher education. HEPI measures the average relative level in the prices of a fixed market basket of goods and services typically purchased by colleges and universities through current-fund educational and general expenditures, excluding expenditures for research. Educational and general expenditures include the functions of instruction and departmental research, extension and public services, educational programs such as workshops and instructional institutes supported by sponsors outside the institution, student services, general administration and expenses, staff benefits, libraries, and operation and maintenance of the physical plant. Sponsored research, sales and services of education departments, and auxiliary enterprises are not priced by HEPI. The index is calculated on a fiscal year basis ending each June 30, by the Commonfund Institute, a branch of Commonfund, a non-profit organization devoted to the management of college and university endowments.
This page lists details of the consumer price index by country
In statistics, a deflator is a value that allows data to be measured over time in terms of some base period, usually through a price index, in order to distinguish between changes in the money value of a gross national product (GNP) that come from a change in prices, and changes from a change in physical output. It is the measure of the price level for some quantity. A deflator serves as a price index in which the effects of inflation are nulled. It is the difference between real and nominal GDP.
Inflation rate in India was 5.5% as of May 2019, as per the Indian Ministry of Statistics and Programme Implementation. This represents a modest reduction from the previous annual figure of 9.6% for June 2011. Inflation rates in India are usually quoted as changes in the Wholesale Price Index (WPI), for all commodities.
The United States Chained Consumer Price Index (C-CPI-U), also known as chain-weighted CPI or chain-linked CPI is a time series measure of price levels of consumer goods and services created by the Bureau of Labor Statistics as an alternative to the US Consumer Price Index. It is based on the idea that when prices of different goods change at different rates, consumers will adjust their purchasing patterns by purchasing more of products whose relative prices have declined and fewer of those whose relative price has increased. This reduces the cost of living reported, but has no change on the cost of living; it is simply a way of accounting for a microeconomic "substitution effect." The "fixed weight" CPI also takes such substitutions into account, but does so through a periodic adjustment of the "basket of goods" that it represents, rather than through a continuous adjustment in that basket. Application of the chained CPI to federal benefits has been controversially proposed to reduce the federal deficit.