Phylogenetic comparative methods

Last updated

Phylogenetic comparative methods (PCMs) use information on the historical relationships of lineages (phylogenies) to test evolutionary hypotheses. The comparative method has a long history in evolutionary biology; indeed, Charles Darwin used differences and similarities between species as a major source of evidence in The Origin of Species . However, the fact that closely related lineages share many traits and trait combinations as a result of the process of descent with modification means that lineages are not independent. This realization inspired the development of explicitly phylogenetic comparative methods. [1] Initially, these methods were primarily developed to control for phylogenetic history when testing for adaptation; [2] however, in recent years the use of the term has broadened to include any use of phylogenies in statistical tests. [3] Although most studies that employ PCMs focus on extant organisms, many methods can also be applied to extinct taxa and can incorporate information from the fossil record. [4]

Contents

PCMs can generally be divided into two types of approaches: those that infer the evolutionary history of some character (phenotypic or genetic) across a phylogeny and those that infer the process of evolutionary branching itself (diversification rates), though there are some approaches that do both simultaneously. [5] Typically the tree that is used in conjunction with PCMs has been estimated independently (see computational phylogenetics) such that both the relationships between lineages and the length of branches separating them is assumed to be known.

Applications

Phylogenetic comparative approaches can complement other ways of studying adaptation, such as studying natural populations, experimental studies, and mathematical models. [6] Interspecific comparisons allow researchers to assess the generality of evolutionary phenomena by considering independent evolutionary events. Such an approach is particularly useful when there is little or no variation within species. And because they can be used to explicitly model evolutionary processes occurring over very long time periods, they can provide insight into macroevolutionary questions, once the exclusive domain of paleontology. [4]

Home range areas of 49 species of mammals in relation to their body size. Larger-bodied species tend to have larger home ranges, but at any given body size members of the order Carnivora (carnivores and omnivores) tend to have larger home ranges than ungulates (all of which are herbivores). Whether this difference is considered statistically significant depends on what type of analysis is applied Home Range 49 Mammals 1.jpg
Home range areas of 49 species of mammals in relation to their body size. Larger-bodied species tend to have larger home ranges, but at any given body size members of the order Carnivora (carnivores and omnivores) tend to have larger home ranges than ungulates (all of which are herbivores). Whether this difference is considered statistically significant depends on what type of analysis is applied
Testes mass of various species of Primates in relation to their body size and mating system. Larger-bodied species tend to have larger testes, but at any given body size species in which females tend to mate with multiple males have males with larger testes. Primate Testes Allometry Sexual Selection.jpg
Testes mass of various species of Primates in relation to their body size and mating system. Larger-bodied species tend to have larger testes, but at any given body size species in which females tend to mate with multiple males have males with larger testes.

Phylogenetic comparative methods are commonly applied to such questions as:

Example: how does brain mass vary in relation to body mass?

Example: do canids have larger hearts than felids?

Example: do carnivores have larger home ranges than herbivores?

Example: where did endothermy evolve in the lineage that led to mammals?

Example: where, when, and why did placentas and viviparity evolve?

Example: are behavioral traits more labile during evolution?

Example: why do small-bodied species have shorter life spans than their larger relatives?

Phylogenetically independent contrasts

The standardized contrasts are used in conventional statistical procedures, with the constraint that all regressions, correlations, analysis of covariance, etc., must pass through the origin. Phylogenetically Independent Contrasts 1.jpg
The standardized contrasts are used in conventional statistical procedures, with the constraint that all regressions, correlations, analysis of covariance, etc., must pass through the origin.

Felsenstein [1] proposed the first general statistical method in 1985 for incorporating phylogenetic information, i.e., the first that could use any arbitrary topology (branching order) and a specified set of branch lengths. The method is now recognized as an algorithm that implements a special case of what are termed phylogenetic generalized least-squares models. [8] The logic of the method is to use phylogenetic information (and an assumed Brownian motion like model of trait evolution) to transform the original tip data (mean values for a set of species) into values that are statistically independent and identically distributed.

The algorithm involves computing values at internal nodes as an intermediate step, but they are generally not used for inferences by themselves. An exception occurs for the basal (root) node, which can be interpreted as an estimate of the ancestral value for the entire tree (assuming that no directional evolutionary trends [e.g., Cope's rule] have occurred) or as a phylogenetically weighted estimate of the mean for the entire set of tip species (terminal taxa). The value at the root is equivalent to that obtained from the "squared-change parsimony" algorithm and is also the maximum likelihood estimate under Brownian motion. The independent contrasts algebra can also be used to compute a standard error or confidence interval.

Phylogenetic generalized least squares (PGLS)

Probably the most commonly used PCM is phylogenetic generalized least squares (PGLS). [8] [9] This approach is used to test whether there is a relationship between two (or more) variables while accounting for the fact that lineage are not independent. The method is a special case of generalized least squares (GLS) and as such the PGLS estimator is also unbiased, consistent, efficient, and asymptotically normal. [10] In many statistical situations where GLS (or, ordinary least squares [OLS]) is used residual errors ε are assumed to be independent and identically distributed random variables that are assumed to be normal

whereas in PGLS the errors are assumed to be distributed as

where V is a matrix of expected variance and covariance of the residuals given an evolutionary model and a phylogenetic tree. Therefore, it is the structure of residuals and not the variables themselves that show phylogenetic signal. This has long been a source of confusion in the scientific literature. [11] A number of models have been proposed for the structure of V such as Brownian motion [8] Ornstein-Uhlenbeck, [12] and Pagel's λ model. [13] (When a Brownian motion model is used, PGLS is identical to the independent contrasts estimator. [14] ). In PGLS, the parameters of the evolutionary model are typically co-estimated with the regression parameters.

PGLS can only be applied to questions where the dependent variable is continuously distributed; however, the phylogenetic tree can also be incorporated into the residual distribution of generalized linear models, making it possible to generalize the approach to a broader set of distributions for the response. [15] [16] [17]

Phylogenetically informed Monte Carlo computer simulations

Data for a continuous-valued trait can be simulated in such a way that taxa at the tips of a hypothetical phylogenetic tree will exhibit phylogenetic signal, i.e., closely related species will tend to resemble each other. Phylogenetic Computer Simulations 1.jpg
Data for a continuous-valued trait can be simulated in such a way that taxa at the tips of a hypothetical phylogenetic tree will exhibit phylogenetic signal, i.e., closely related species will tend to resemble each other.

Martins and Garland [18] proposed in 1991 that one way to account for phylogenetic relations when conducting statistical analyses was to use computer simulations to create many data sets that are consistent with the null hypothesis under test (e.g., no correlation between two traits, no difference between two ecologically defined groups of species) but that mimic evolution along the relevant phylogenetic tree. If such data sets (typically 1,000 or more) are analyzed with the same statistical procedure that is used to analyze a real data set, then results for the simulated data sets can be used to create phylogenetically correct (or "PC" [7] ) null distributions of the test statistic (e.g., a correlation coefficient, t, F). Such simulation approaches can also be combined with such methods as phylogenetically independent contrasts or PGLS (see above).

Phylogenetic Pseudoreplication.jpg

See also

Related Research Articles

In biology, phylogenetics is the study of the evolutionary history and relationships among or within groups of organisms. These relationships are determined by phylogenetic inference, methods that focus on observed heritable traits, such as DNA sequences, protein amino acid sequences, or morphology. The result of such an analysis is a phylogenetic tree—a diagram containing a hypothesis of relationships that reflects the evolutionary history of a group of organisms.

A phylogenetic tree, phylogeny or evolutionary tree is a graphical representation which shows the evolutionary history between a set of species or taxa during a specific time. In other words, it is a branching diagram or a tree showing the evolutionary relationships among various biological species or other entities based upon similarities and differences in their physical or genetic characteristics. In evolutionary biology, all life on Earth is theoretically part of a single phylogenetic tree, indicating common ancestry. Phylogenetics is the study of phylogenetic trees. The main challenge is to find a phylogenetic tree representing optimal evolutionary ancestry between a set of species or taxa. Computational phylogenetics focuses on the algorithms involved in finding optimal phylogenetic tree in the phylogenetic landscape.

The molecular clock is a figurative term for a technique that uses the mutation rate of biomolecules to deduce the time in prehistory when two or more life forms diverged. The biomolecular data used for such calculations are usually nucleotide sequences for DNA, RNA, or amino acid sequences for proteins.

In phylogenetics and computational phylogenetics, maximum parsimony is an optimality criterion under which the phylogenetic tree that minimizes the total number of character-state changes. Under the maximum-parsimony criterion, the optimal tree will minimize the amount of homoplasy. In other words, under this criterion, the shortest possible tree that explains the data is considered best. Some of the basic ideas behind maximum parsimony were presented by James S. Farris in 1970 and Walter M. Fitch in 1971.

In phylogenetics, long branch attraction (LBA) is a form of systematic error whereby distantly related lineages are incorrectly inferred to be closely related. LBA arises when the amount of molecular or morphological change accumulated within a lineage is sufficient to cause that lineage to appear similar to another long-branched lineage, solely because they have both undergone a large amount of change, rather than because they are related by descent. Such bias is more common when the overall divergence of some taxa results in long branches within a phylogeny. Long branches are often attracted to the base of a phylogenetic tree, because the lineage included to represent an outgroup is often also long-branched. The frequency of true LBA is unclear and often debated, and some authors view it as untestable and therefore irrelevant to empirical phylogenetic inference. Although often viewed as a failing of parsimony-based methodology, LBA could in principle result from a variety of scenarios and be inferred under multiple analytical paradigms.

<span class="mw-page-title-main">Joseph Felsenstein</span> American phylogeneticist

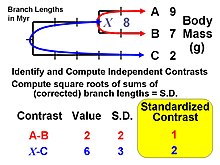
Joseph "Joe" Felsenstein is a Professor Emeritus in the Departments of Genome Sciences and Biology at the University of Washington in Seattle. He is best known for his work on phylogenetic inference, and is the author of Inferring Phylogenies, and principal author and distributor of the package of phylogenetic inference programs called PHYLIP. Closely related to his work on phylogenetic inference is his introduction of methods for making statistically independent comparisons using phylogenies.

Computational phylogenetics, phylogeny inference, or phylogenetic inference focuses on computational and optimization algorithms, heuristics, and approaches involved in phylogenetic analyses. The goal is to find a phylogenetic tree representing optimal evolutionary ancestry between a set of genes, species, or taxa. Maximum likelihood, parsimony, Bayesian, and minimum evolution are typical optimality criteria used to assess how well a phylogenetic tree topology describes the sequence data. Nearest Neighbour Interchange (NNI), Subtree Prune and Regraft (SPR), and Tree Bisection and Reconnection (TBR), known as tree rearrangements, are deterministic algorithms to search for optimal or the best phylogenetic tree. The space and the landscape of searching for the optimal phylogenetic tree is known as phylogeny search space.

Ancestral reconstruction is the extrapolation back in time from measured characteristics of individuals, populations, or specie to their common ancestors. It is an important application of phylogenetics, the reconstruction and study of the evolutionary relationships among individuals, populations or species to their ancestors. In the context of evolutionary biology, ancestral reconstruction can be used to recover different kinds of ancestral character states of organisms that lived millions of years ago. These states include the genetic sequence, the amino acid sequence of a protein, the composition of a genome, a measurable characteristic of an organism (phenotype), and the geographic range of an ancestral population or species. This is desirable because it allows us to examine parts of phylogenetic trees corresponding to the distant past, clarifying the evolutionary history of the species in the tree. Since modern genetic sequences are essentially a variation of ancient ones, access to ancient sequences may identify other variations and organisms which could have arisen from those sequences. In addition to genetic sequences, one might attempt to track the changing of one character trait to another, such as fins turning to legs.

Biological constraints are factors which make populations resistant to evolutionary change. One proposed definition of constraint is "A property of a trait that, although possibly adaptive in the environment in which it originally evolved, acts to place limits on the production of new phenotypic variants." Constraint has played an important role in the development of such ideas as homology and body plans.

Bayesian inference of phylogeny combines the information in the prior and in the data likelihood to create the so-called posterior probability of trees, which is the probability that the tree is correct given the data, the prior and the likelihood model. Bayesian inference was introduced into molecular phylogenetics in the 1990s by three independent groups: Bruce Rannala and Ziheng Yang in Berkeley, Bob Mau in Madison, and Shuying Li in University of Iowa, the last two being PhD students at the time. The approach has become very popular since the release of the MrBayes software in 2001, and is now one of the most popular methods in molecular phylogenetics.

<span class="mw-page-title-main">Evolutionary physiology</span> Study of changes in physiological characteristics

Evolutionary physiology is the study of the biological evolution of physiological structures and processes; that is, the manner in which the functional characteristics of individuals in a population of organisms have responded to natural selection across multiple generations during the history of the population. It is a sub-discipline of both physiology and evolutionary biology. Practitioners in the field come from a variety of backgrounds, including physiology, evolutionary biology, ecology, and genetics.

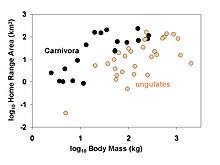
Paul H. Harvey is a British evolutionary biologist. He is Professor of Zoology and was head of the zoology department at the University of Oxford from 1998 to 2011 and Secretary of the Zoological Society of London from 2000 to 2011, holding these posts in conjunction with a professorial fellowship at Jesus College, Oxford.

Theodore Garland Jr. is a biologist specializing in evolutionary physiology at the University of California, Riverside.

Ziheng Yang FRS is a Chinese biologist. He holds the R.A. Fisher Chair of Statistical Genetics at University College London, and is the Director of R.A. Fisher Centre for Computational Biology at UCL. He was elected a Fellow of the Royal Society in 2006.

Mark David Pagel FRS is an evolutionary biologist and professor. He heads the Evolutionary Biology Group at the University of Reading. He is known for comparative studies in evolutionary biology. In 1994, with his spouse, anthropologist Ruth Mace, Pagel pioneered the Comparative Method in Anthropology.

Microbial phylogenetics is the study of the manner in which various groups of microorganisms are genetically related. This helps to trace their evolution. To study these relationships biologists rely on comparative genomics, as physiology and comparative anatomy are not possible methods.

The term phylogenetic niche conservatism has seen increasing use in recent years in the scientific literature, though the exact definition has been a matter of some contention. Fundamentally, phylogenetic niche conservatism refers to the tendency of species to retain their ancestral traits. When defined as such, phylogenetic niche conservatism is therefore nearly synonymous with phylogenetic signal. The point of contention is whether or not "conservatism" refers simply to the tendency of species to resemble their ancestors, or implies that "closely related species are more similar than expected based on phylogenetic relationships". If the latter interpretation is employed, then phylogenetic niche conservatism can be seen as an extreme case of phylogenetic signal, and implies that the processes which prevent divergence are in operation in the lineage under consideration. Despite efforts by Jonathan Losos to end this habit, however, the former interpretation appears to frequently motivate scientific research. In this case, phylogenetic niche conservatism might best be considered a form of phylogenetic signal reserved for traits with broad-scale ecological ramifications. Thus, phylogenetic niche conservatism is usually invoked with regards to closely related species occurring in similar environments.

<span class="mw-page-title-main">Homoplasy</span> Gain or loss of the same feature independently in separate lineages during evolution

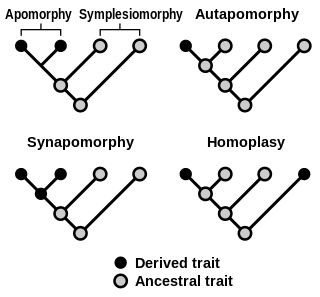
Homoplasy, in biology and phylogenetics, is the term used to describe a feature that has been gained or lost independently in separate lineages over the course of evolution. This is different from homology, which is the term used to characterize the similarity of features that can be parsimoniously explained by common ancestry. Homoplasy can arise from both similar selection pressures acting on adapting species, and the effects of genetic drift.

<span class="mw-page-title-main">Phylogenetic signal</span>

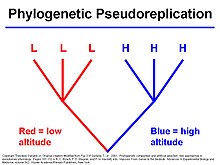
Phylogenetic signal is an evolutionary and ecological term, that describes the tendency or the pattern of related biological species to resemble each other more than any other species that is randomly picked from the same phylogenetic tree.

References

  1. 1 2 Felsenstein, Joseph (January 1985). "Phylogenies and the Comparative Method". The American Naturalist. 125 (1): 1–15. doi:10.1086/284325. S2CID   9731499.
  2. Harvey, Paul H.; Pagel, Mark D. (1991). The Comparative Method in Evolutionary Biology. Oxford: Oxford University Press. p. 248. ISBN   9780198546405.
  3. O'Meara, Brian C. (December 2012). "Evolutionary Inferences from Phylogenies: A Review of Methods". Annual Review of Ecology, Evolution, and Systematics. 43 (1): 267–285. doi:10.1146/annurev-ecolsys-110411-160331.
  4. 1 2 Pennell, Matthew W.; Harmon, Luke J. (June 2013). "An integrative view of phylogenetic comparative methods: connections to population genetics, community ecology, and paleobiology". Annals of the New York Academy of Sciences. 1289 (1): 90–105. Bibcode:2013NYASA1289...90P. doi:10.1111/nyas.12157. PMID   23773094. S2CID   8384900.
  5. Maddison, Wayne; Midford, Peter; Otto, Sarah (October 2007). "Estimating a Binary Character's Effect on Speciation and Extinction". Systematic Biology. 56 (5): 701–710. doi: 10.1080/10635150701607033 . PMID   17849325.
  6. Weber, Marjorie G.; Agrawal, Anurag A. (July 2012). "Phylogeny, ecology, and the coupling of comparative and experimental approaches". Trends in Ecology & Evolution. 27 (7): 394–403. doi:10.1016/j.tree.2012.04.010. PMID   22658878.
  7. 1 2 Garland, T.; Dickerman, A. W.; Janis, C. M.; Jones, J. A. (1 September 1993). "Phylogenetic Analysis of Covariance by Computer Simulation". Systematic Biology. 42 (3): 265–292. doi:10.1093/sysbio/42.3.265.
  8. 1 2 3 Grafen, A. (21 December 1989). "The Phylogenetic Regression". Philosophical Transactions of the Royal Society B: Biological Sciences. 326 (1233): 119–157. Bibcode:1989RSPTB.326..119G. doi: 10.1098/rstb.1989.0106 . PMID   2575770.
  9. Martins, Emilia P.; Hansen, Thomas F. (April 1997). "Phylogenies and the Comparative Method: A General Approach to Incorporating Phylogenetic Information into the Analysis of Interspecific Data". The American Naturalist. 149 (4): 646–667. doi:10.1086/286013. S2CID   29362369.
  10. Rohlf, F. James (November 2001). "Comparative methods for the analysis of continuous variables: geometric interpretations". Evolution. 55 (11): 2143–2160. doi: 10.1111/j.0014-3820.2001.tb00731.x . PMID   11794776. S2CID   23200090.
  11. Revell, Liam J. (December 2010). "Phylogenetic signal and linear regression on species data". Methods in Ecology and Evolution. 1 (4): 319–329. doi: 10.1111/j.2041-210x.2010.00044.x .
  12. Butler, Marguerite A.; Schoener, Thomas W.; Losos, Jonathan B. (February 2000). "The relationship between sexual size dimorphism and habitat use in Greater Antillean lizards". Evolution. 54 (1): 259–272. doi: 10.1111/j.0014-3820.2000.tb00026.x . PMID   10937202. S2CID   7887284.
  13. Freckleton, R. P.; Harvey, P. H.; Pagel, M. (December 2002). "Phylogenetic Analysis and Comparative Data: A Test and Review of Evidence". The American Naturalist. 160 (6): 712–726. doi:10.1086/343873. PMID   18707460. S2CID   19796539.
  14. Blomberg, S. P.; Lefevre, J. G.; Wells, J. A.; Waterhouse, M. (3 January 2012). "Independent Contrasts and PGLS Regression Estimators Are Equivalent". Systematic Biology. 61 (3): 382–391. doi: 10.1093/sysbio/syr118 . PMID   22215720.
  15. Lynch, Michael (August 1991). "Methods for the Analysis of Comparative Data in Evolutionary Biology". Evolution. 45 (5): 1065–1080. doi:10.2307/2409716. JSTOR   2409716. PMID   28564168.
  16. Housworth, Elizabeth A.; Martins, Emília P.; Lynch, Michael (January 2004). "The Phylogenetic Mixed Model". The American Naturalist. 163 (1): 84–96. doi:10.1086/380570. PMID   14767838. S2CID   10568814.
  17. Hadfield, J. D.; Nakagawa, S. (March 2010). "General quantitative genetic methods for comparative biology: phylogenies, taxonomies and multi-trait models for continuous and categorical characters". Journal of Evolutionary Biology. 23 (3): 494–508. doi: 10.1111/j.1420-9101.2009.01915.x . PMID   20070460. S2CID   27706318.
  18. Martins, Emilia P.; Garland, Theodore (May 1991). "Phylogenetic Analyses of the Correlated Evolution of Continuous Characters: A Simulation Study". Evolution. 45 (3): 534–557. doi:10.2307/2409910. JSTOR   2409910. PMID   28568838.

Further reading

Journals

Software packages (incomplete list)

Laboratories