Share of population in extreme poverty, 1981 to 2017Poverty rate map of India by prevalence in 2012, among its states and union territoriesSlums near the international airport in Mumbai/BombayIndia Poverty rate since 1993 based on World Bank $2.00 ppp value
Poverty in India remains a major challenge despite overall reductions in the last several decades as its economy grows. According to an International Monetary Fund paper, extreme poverty, defined by the World Bank as living on US$1.9 or less in purchasing power parity (PPP) terms, in India was as low as 0.8% in 2019, and the country managed to keep it at that level in 2020 despite the unprecedented COVID-19 outbreak.[1][2] According to the World Bank, India experienced a significant decline in the prevalence of extreme poverty from 22.5% in 2011 to 10.2% in 2019. A working paper of the bank said rural poverty declined from 26.3% in 2011 to 11.6% in 2019. The decline in urban areas was from 14.2% to 6.3% in the same period. The poverty level in rural and urban areas went down by 14.7 and 7.9 percentage points, respectively.[3] According to United Nations Development Programme administrator Achim Steiner, India lifted 271 million people out of extreme poverty in a 10-year time period from 2005–2006 to 2015–2016. A 2020 study from the World Economic Forum found "Some 220 million Indians sustained on an expenditure level of less than Rs 32 / day—the poverty line for rural India—by the last headcount of the poor in India in 2013."[4]
The World Bank has been revising its definition and benchmarks to measure poverty since 1990–1991, with a $0.2 per day income on purchasing power parity basis as the definition in use from 2005 to 2013.[5] Some semi-economic and non-economic indices have also been proposed to measure poverty in India. For example, in order to determine whether a person is poor, the Multi-dimensional Poverty Index places a 33% weight on the number of years that person spent in school or engaged in education and a 6.25% weight on the financial condition of that person.[6]
The different definitions and underlying small sample surveys used to determine poverty in India have resulted in widely varying estimates of poverty from the 1950s to 2010s. In 2019, the Indian government stated that 6.7% of its population is below its official poverty limit.[7] Based on 2019's PPPs International Comparison Program,[8][9][10] According to the United Nations Millennium Development Goals (MDG) programme, 80 million people out of 1.2 billion Indians, roughly equal to 6.7% of India's population, lived below the poverty line of $1.25 [11] and 84% of Indians lived on less than $6.85 per day in 2019.[12] According to the second edition of the Multidimensional Poverty Index (MPI) released by Niti Aayog, approximately 14.96% of India's population is considered to be in a state of multidimensional poverty.[13] The National Multidimensional Poverty Index (MPI) assesses simultaneous deprivations in health, education, and standard of living, with each dimension carrying equal weight. These deprivations are measured using 12 indicators aligned with the Sustainable Development Goals (SDGs).[14] On July 17, 2023, Niti Aayog reported a significant reduction in the proportion of poor people in the country, declining from 24.8% to 14.9% during the period from 2015–16 to 2019–21. This improvement was attributed to advancements in nutrition, years of schooling, sanitation, and the availability of subsidized cooking fuel.[15] As per the report, approximately 135 million people in India were lifted out of multidimensional poverty between 2015–16 and 2019–21.[16]
From the late 19th century through the early 20th century, under the British Raj, poverty in India intensified, peaking in the 1920s.[17][18]Famines and diseases killed millions in multiple vicious cycles throughout the 19th and early 20th centuries.[19][20] After India gained its independence in 1947, mass deaths from famines were prevented.[21] Since 1991, rapid economic growth has led to a sharp reduction in extreme poverty in India.[22][23] However, those above the poverty line live a fragile economic life.[24] As per the methodology of the Suresh Tendulkar Committee report, the population below the poverty line in India was 354 million (29.6% of the population) in 2009–2010 and was 269 million (21.9% of the population) in 2011–2012.[25] In 2014, the Rangarajan Committee said that the population below the poverty line was 454 million (38.2% of the population) in 2009–2010 and was 363 million (29.5% of the population) in 2011–2012.[26] Deutsche Bank Research estimated that there are nearly 300 million people who are in the middle class.[27] If these previous trends continue, India's share of world GDP will significantly increase from 7.3% in 2016 to 8.5% by 2020.[28] In 2012, around 170 million people, or 12.4% of India's population, lived in poverty (defined as $1.90 (Rs 123.5)), an improvement from 29.8% of India's population in 2009.[29][30] In their paper, economists Sandhya Krishnan and Neeraj Hatekar conclude that 600 million people, or more than half of India's population, belong to the middle class.[31]
The Asian Development Bank estimates India's population to be at 1.28 billion with an average growth rate of 1.3% from 2010 to 2015. In 2014, 9.9% of the population aged 15 years and above were employed. 6.9% of the population still lives below the national poverty line and 63% in extreme poverty (December 2018)[32] The World Poverty Clock shows real-time poverty trends in India, which are based on the latest data, of the World Bank, among others. As per recent estimates, the country is well on its way of ending extreme poverty by meeting its sustainable development goals by 2030.[33] According to Oxfam, India's top 1% of the population now holds 73% of the wealth, while 670 million citizens, comprising the country's poorest half, saw their wealth rise by just 1%.[34]
Definition of poverty
Poverty is the state of not having enough material possessions or income for a person basic need. Poverty may include social, economic, and political elements. Absolute poverty is the complete lack of the means necessary to meet basic personal needs, such as food, clothing, and shelter.
Economic measures
There are several definitions of poverty, and scholars disagree as to which definition is appropriate for India.[35][36] Inside India, both income-based poverty definition and consumption-based poverty statistics are in use.[37] Outside India, the World Bank and institutions of the United Nations use a broader definition to compare poverty among nations, including India, based on purchasing power parity (PPP), as well as nominal relative basis.[38][39] Each state in India has its own poverty threshold to determine how many people are below its poverty line and to reflect regional economic conditions. These differences in definitions yield a complex and conflicting picture about poverty in India, both internally and when compared to other developing countries of the world.[40]
According to the World Bank, India accounted for the world's largest number of poor people in 2012 using revised methodology to measure poverty, reflecting its massive population. However, in terms of percentage, it scored somewhat lower than other countries holding large poor populations.[41] In July 2018, World Poverty Clock, a Vienna-based think tank, reported that a minimal 5.3% or 70.6 million Indians lived in extreme poverty compared to 44% or 87 million Nigerians. In 2019, Nigeria and Congo surpassed India in terms of total population earning below $1.9 a day.[42][43] Although India is expected to meet the United Nations' Sustainable Development Goals on extreme poverty in due time, a very large share of its population lives on less than $3.2 a day, putting India's economy safely into the category of lower middle income economies.
As with many countries,[44] poverty was historically defined and estimated in India using a sustenance food standard. This methodology has been revised. India's current official poverty rates are based on its Planning Commission's data derived from so-called Tendulkar methodology.[45] It defines poverty not in terms of annual income, but in terms of consumption or spending per individual over a certain period for a basket of essential goods. Furthermore, this methodology sets different poverty lines for rural and urban areas. Since 2007, India has set its official threshold at ₹ 26 a day ($0.43) in rural areas and about ₹ 32 per day ($0.53) in urban areas.[46] While these numbers are lower than the World Bank's $1.25 per day income-based definition, the definition is similar to China's US$0.65 per day official poverty line in 2008.[47]
The World Bank's international poverty line definition is based on purchasing power parity basis, at $1.25 per day.[48][49] This definition is motivated by the fact that the price of the same goods and services can differ significantly when converted into local currencies around the world. A realistic definition and comparison of poverty must consider these differences in costs of living, or must be on purchasing power parity (PPP) basis. On this basis, currency fluctuations and nominal numbers become less important, the definition is based on the local costs of a basket of essential goods and services that people can purchase. By World Bank's 2014 PPP definition, India's poverty rate is significantly lower than previously believed.[40]
Mixed, semi-economic and non-economic measures
As with economic measures, there are many mixed or non-economic measures of poverty and experts contest which one is most appropriate for India. For example, Dandekar and Rath in 1971 suggested a measure of poverty rate that was based on number of calories consumed.[50] In 2011, Alkire et al. suggested a poverty rate measure so-called Multi-dimensional Poverty Index (MPI), which only puts a 6.25% weight to assets owned by a person and places 33% weight on education and number of years spent in school.[6] These non-economic measures remain controversial and contested as a measure of poverty rate of any nation, including India.[51][52]
In 2023, the NITI Aayog published the National Multidimensional Poverty Index: A Progress Review 2023.[53] The percentage of the total population who are multidimensionally poor in each State and Union Territory and the percentage point change in the headcount ratio between 2015-16 and 2019-21 are given below[54]:
State or Union Territory
% of Population who are multidimensionally poor NFHS-5 (2019-21)
% of Population who are multidimensionally poor NFHS-4 (2015-16)
Percentage point change in headcount ratio between 2015-16 and 2019-21
Comparison with alternate international definitions
India determines its household poverty line by summing up the individual per capita poverty lines of the household members. This practice is similar to many developing countries, but different from developed countries such as the United States who adjusts their poverty line on an incremental basis per additional household member. For example, in the United States, the poverty line for a household with just one member was set at $11,670 per year for 2014, while it was set at $23,850 per year for a 4-member household (or $5963 per person for the larger household).[60] The rationale for the differences arise from the economic realities of each country. In India, households may include surviving grandparents, parents, and children. They typically do not incur any or significant rent expenses every month particularly in rural India, unlike housing in mostly urban developed economies. The cost of food and other essentials are shared within the household by its members in both cases. However, a larger portion of a monthly expenditure goes to food in poor households in developing countries,[61] while housing, conveyance, and other essentials cost significantly more in developed economies.
For its current poverty rate measurements, India calculates two benchmarks. The first includes a basket of goods, including food items but excluding the implied value of home, value of any means of conveyance or the economic value of other essentials created, grown or used without a financial transaction, by the members of a household. The second poverty line benchmark adds rent value of residence as well as the cost of conveyance, but nothing else, to the first benchmark.[62] This practice is similar to those used in developed countries for non-cash income equivalents and a poverty line basis.[63][64]
India's proposed but not yet adopted official poverty line, in 2014, was ₹972 (US$12) a month in rural areas or ₹1,407 (US$18) a month in cities. The current poverty line is 1,059.42 Indian Rupees (62 PPP USD) per month in rural areas and 1,286 Indian rupees (75 PPP USD) per month in urban areas.[65] India's nationwide average poverty line differs from each state's poverty line. For example, in 2011–2012, Puducherry had its highest poverty line of ₹1,301 (US$16) a month in rural and ₹1,309 (US$16) a month in urban areas, while Odisha had the lowest poverty thresholds of ₹695 (US$8.70) a month for rural and ₹861 (US$11) a month for its urban areas.[66]
Poverty prevalence and estimates
The 19th century and early 20th century saw increasing poverty in India during the colonial era.[17][67] Over this period, the colonial government de-industrialized India by reducing garments and other finished products manufactured by artisans in India. Instead, they imported these products from Britain's expanding industry due to the many industrial innovations of the 19th century. Additionally, the government simultaneously encouraged the conversion of more land into farms and more agricultural exports from India.[68][69] Eastern regions of India along the Ganges river plains, such as those now known as eastern Uttar Pradesh, Bihar, Jharkhand and West Bengal,[70] were dedicated to producing poppy and opium. These items were then exported to southeast and east Asia, particularly China. The East India Company initially held an exclusive monopoly over these exports, and the colonial British institutions later did so as well.[71] The economic importance of this shift from industry to agriculture in India was large;[72] by 1850, it created nearly 1,000 square kilometres of poppy farms India's fertile Ganges plains. This consequently led to two opium wars in Asia, with the second opium war fought between 1856 and 1860. After China agreed to be a part of the opium trade, the colonial government dedicated more land exclusively to poppy.[69] The opium agriculture in India rose from 1850 through 1900, when over 500,000 acres of the most fertile Ganges basin farms were devoted to poppy cultivation.[73] Additionally, opium processing factories owned by colonial officials were expanded in Benares and Patna, and shipping expanded from Bengal to the ports of East Asia such as Hong Kong, all under exclusive monopoly of the British. By the early 20th century, 3 out of 4 Indians were employed in agriculture, famines were common, and food consumption per capita declined in every decade.[18] In London, the late 19th century British parliament debated the repeated incidence of famines in India, and the impoverishment of Indians due to this diversion of agriculture land from growing food staples to growing poppy for opium export under orders of the colonial British empire.[69][73]
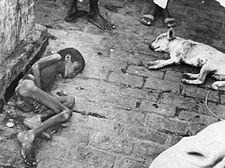
Poverty was intense during colonial era India. Numerous famines and epidemics killed millions of people each.[19][74] Upper image is from 1876 to 1879 famine in South of British India that starved and killed over 6 million people, while lower image is of child who starved to death during the Bengal famine of 1943.
These colonial policies moved unemployed artisans into farming, and transformed India into a region increasingly abundant in land, unskilled labour, and low productivity. This consequently made India scarce in skilled labour, capital and knowledge.[17][18] On an inflation adjusted 1973 rupee basis, the average income of an Indian agrarian labourer was Rs. 7.20 per year in 1885, against an inflation adjusted poverty line of Rs. 23.90 per year. Thus, not only was the average income below the poverty line, but the intensity of poverty was also severe. The intensity of poverty increased from 1885 to 1921, before being reversed. However, the absolute poverty rates continued to be very high through the 1930s.[17][75] The colonial policies on taxation and its recognition of land ownership claims of zamindars and mansabdars, or Mughal era nobility, made a minority of families wealthy. Additionally, these policies weakened the ability of poorer peasants to command land and credit. The resulting rising landlessness and stagnant real wages intensified poverty.[17][76]
The National Planning Committee of 1936 noted the appalling poverty of undivided India.[77]
(...) there was lack of food, of clothing, of housing and of every other essential requirement of human existence... the development policy objective should be to get rid of the appalling poverty of the people.
—Nehru, The Discovery of India, (1946)
The National Planning Committee, notes Suryanarayana, then defined goals in 1936 to alleviate poverty by setting targets in terms of nutrition (2400 to 2800 calories per adult worker), clothing (30 yards per capita per annum) and housing (100 sq. ft per capita).[77] This method of linking poverty as a function of nutrition, clothing and housing continued in India after it became independent from British colonial empire.
These poverty alleviation goals were theoretical, with administrative powers resident in the British Empire. Poverty ravaged India. In 1943, for example, despite rising agricultural output in undivided South Asia, the Bengal famine killed millions of Indians from starvation, disease and destitution. Destitution was so intense in Bengal, Bihar, eastern Uttar Pradesh, Jharkhand and Orissa, that entire families and villages were "wiped out" of existence. Village artisans, along with sustenance farming families, died from lack of food, malnutrition and a wave of diseases.[20] The 1943 famine was not an isolated tragedy. Devastating famines impoverished India every 5 to 8 years in the late 19th century and the first half of the 20th century. Between 6.1 and 10.3 million people starved to death in British India during the 1876–1879 famine, while another 6.1 to 8.4 million people died during the 1896–1898 famine.[78]The Lancet reported that 19 million people died from starvation and the consequences of extreme poverty in British India between 1896 and 1900.[79] Sir MacDonnell observed the suffering and poverty in 1900, and noted, "people died like flies" in Bombay.[80]
Minhas published his estimates of poverty rates in 1950s India as cyclical and a strong function of each year's harvest. Minhas disagreed with the practice of using calories as the basis for poverty estimation and proposed a poverty line based on real expenditure per year (Rs 240 per annum). In 1956–57, a good harvest year, he computed India's poverty rate to be 65% (215 million people).[81][82] For 1960, Minhas estimated the poverty to be 59%.[83]
1960s
A Working Group was formed in 1962 to attempt to set a poverty line for India.[84][85] This Working Group used calories required for survival, and income needed to buy those calories in different parts of rural India, to derive an average poverty line of Rs. 20 per month at 1960–61 prices.[86]
Estimates of poverty in India during the 1960s varied widely. Dandekar and Rath, on the behalf of then Indian government, estimated that the poverty rate in 1960s remained generally constant at 41%. Ojha, in contrast, estimated that there were 190 million people (44%) in India below official poverty limit in 1961, and that this below-poverty line number increased to 289 million people (70%) in 1967. Bardhan also concluded that Indian poverty rates increased through the 1960s, reaching a high of 54%.[83][87] Those above the 1960s poverty level of Rs 240 per year, were in fragile economic groups as well and not doing well either. Minhas estimated that 95% of India's people lived on Rs 458 per year in 1963–64, while the richest 5% lived on an average of Rs 645 per year (all numbers inflation adjusted to 1960–61 Rupee).[81]
1970s – 1980s
Dandekar and Rath[88] in 1971 used a daily intake of 2,250 calories per person to define the poverty line for India. Using NSSO data regarding household expenditures for 1960–61, they determined that in order to achieve this food intake and other daily necessities, a rural dweller required an annual income of ₹ 170.80 per year (₹ 14.20 per month, adjusted to 1971 Rupee). An urban dweller required ₹ 271.70 per year (₹ 22.60 per month). They concluded from this study that 40 percent of rural residents and 50 percent of urban residents were below the poverty line in 1960–61.[89]
Poverty alleviation has been a driver for India's Planning Commission's Task Force on Projections of Minimum Needs and Effective Consumption Demand of the Perspective Planning Division. This division, in 1979, took into account differences in calorie requirements for different age groups, activity levels, and sex. They determined that the average rural dweller needed around 2400 calories, and those in urban areas required about 2100 calories per person per day. To satisfy the food requirement, the Task Force estimated that a consumer spending in 1973–74 of Rs.49.09 per person per month in rural areas and Rs.56.64 in urban areas was appropriate measure to estimate its poverty line.[90]
Poverty remained stubbornly high in India through the 1970s and 1980s. It created slogans such as Garibi Hatao (meaning eliminate poverty) for political campaigns, during elections in early 1970s through the 1980s.[91] Rural poverty rate exceeded 50%, using India's official poverty line for 1970s.[92][93]
Additionally, in 1976, the Indian government passed the Bonded Labor System Act in an effort to end debt bondage in India, a practice which contributes to generational poverty.[94] Nevertheless, this system is still in place today due to weak enforcement of this law.[94]
1990s
Another Expert Group was instituted in 1993, chaired by Lakdawala, to examine poverty line for India. It recommended that regional economic differences are large enough that poverty lines should be calculated for each state. From then on, a standard list of commodities were drawn up and priced in each state of the nation, using 1973–74 as a base year. This basket of goods could then be re-priced each year and comparisons made between regions. The Government of India began using a modified version of this method of calculating the poverty line in India.[95]
There are wide variations in India's poverty estimates for 1990s, in part from differences in the methodology and in the small sample surveys they poll for the underlying data. A 2007 report for example, using data for late 1990s, stated that 77% of Indians lived on less than ₹ 20 a day (about US$0.50 per day).[96] In contrast, S.G.Datt estimated India's national poverty rate to be 35% in 1994, at India's then official poverty line of Rs 49 per capita, with consumer price index adjusted to June 1974 rural prices.[93]
2000s
The Saxena Committee report, using data from 1972 to 2000, separated calorific intake apart from nominal income in its economic analysis of poverty in India, and then stated that 50% of Indians lived below the poverty line.[97] The Planning Commission of India, in contrast, determined that the poverty rate was 39%.
The National Council of Applied Economic Research estimated that 48% of the Indian households earn more than ₹90,000 (US$1,127.10) annually (or more than US$ 3 PPP per person). According to NCAER, in 2009, of the 222 million households in India, the absolutely poor households (annual incomes below ₹45,000 (US$560)) accounted for only 15.6% of them or about 35 million (about 200 million Indians). Another 80 million households are in the income levels of ₹45,000 (US$560) to ₹90,000 (US$1,100) per year. These numbers are similar to World Bank estimates of the "below-the-poverty-line" households that may total about 100 million (or about 456 million individuals).[98]
The Suresh Tendulkar Committee set up to look into the people living under the poverty line in India submitted its report in November 2009.[99] It provided a new method of calculating the poverty line based on per capita consumption expenditure per month or day. For rural areas, it was Rs 816 per month or Rs 27 per day. For urban areas, it was Rs 1000 per month or Rs 33 per day. Using this methodology, the population below the poverty line in 2009–2010 was 354 million (29.6% of the population) and that in 2011–2012 was 269 million (21.9% of the population).[100]
Reserve Bank of India (2012)
In its annual report of 2012, the Reserve Bank of India named the state of Goa as having the least poverty of 5.09% while the national average stood at 21.92%[7] The table below presents the poverty statistics for rural, urban and combined percentage below poverty line (BPL) for each State or Union Territory.[7] The highest poverty statistics for each category column is coloured light red and the lowest poverty statistics for each category column is coloured light Blue in the table below.
The World Bank has reviewed its poverty definition and calculation methodologies several times over the last 25 years. In early 1990s, The World Bank anchored absolute poverty line as $1 per day. This was revised in 1993, and the absolute poverty line was set at $1.08 a day for all countries on a purchasing power parity (PPP) basis, after adjusting for inflation to the 1993 US dollar. In 2005, after extensive studies of the cost of living across the world, The World Bank raised the measure for global poverty line to reflect the observed higher cost of living.[5] Thereafter, the World Bank determined poverty rates from those living on less than US$1.25 per day on 2005 PPP basis, a measure that has been widely used in media and scholarly circles.
In May 2014, after revisiting its poverty definition, methodology and economic changes around the world, the World Bank proposed another major revision to PPP calculation methodology, international poverty line and indexing it to 2011 US dollar.[40] The new method proposes setting poverty line at $1.78 per day on 2011 PPP basis. According to this revised World Bank methodology, India had 179.6 million people below the new poverty line, China had 137.6 million, and the world had 872.3 million people below the new poverty line on an equivalent basis as of 2013. India, in other words, while having 17.5% of total world's population, had 20.6% share of world's poor.[10][40] In October 2015, the World Bank updated the international poverty line to US$1.90 a day.
The Rangarajan Committee set up to look into the poverty line estimation in India submitted its report in June 2014.[101] It amended the calculation of the poverty line based on per capita consumption expenditure per month or day given by the Tendulkar Committee.[102] The new poverty threshold for rural areas was fixed at Rs 972 per month or Rs 32 per day. For urban areas, it was fixed at Rs 1407 per month or Rs 47 per day. Under this methodology, the population below the poverty line in 2009–2010 was 454 million (38.2% of the population) and that in 2011–2012 was 363 million (29.5% of the population).[103]
From November 2017, the World Bank started reporting poverty rates for all countries using two new international poverty lines: a "lower middle-income" line set at $3.20 per day and an "upper middle-income" line set at $5.50 per day. These are in addition to the earlier poverty line of $1.90 per day. The new lines are supposed to serve two purposes. One, they account for the fact that achieving the same set of capabilities may need a different set of goods and services in different countries and, specifically, a costlier set in richer countries. Second, they allow for cross-country comparisons and benchmarking both within and across developing regions. India falls in the lower middle-income category. Using the $3.20 per day poverty line, the percentage of the population living in poverty in India (2011) was 60%. This means that 763 million people in India were living below this poverty line in 2011.[104]
2020s
The Ministry of Statistics and Programme Implementation conducted the Household Consumption Expenditure Survey (HCES) during August 2022 to July 2023 and the factsheet was published on 24 February 2024.[105] This survey on household consumption expenditure was aimed at generating estimates of household Monthly Per Capita Consumption Expenditure (MPCE) and its distribution separately for rural and urban areas.[106] The below table shows the average MPCE (in rupees) across fractile classes (all-India) in 2022-23[107]:
Fractile class of MPCE
Average MPCE in rupees (with imputation*)
Average MPCE in rupees (without imputation)
Rural
Urban
Rural
Urban
0-5%
1,441
2,087
1,373
2,001
5-10%
1,864
2,695
1,782
2,607
10-20%
2,196
3,241
2,112
3,157
20-30%
2,540
3,839
2,454
3,762
30-40%
2,856
4,422
2,768
4,348
40-50%
3,183
5,032
3,094
4,963
50-60%
3,545
5,726
3,455
5,662
60-70%
3,978
6,579
3,887
6,524
70-80%
4,551
7,721
4,458
7,673
80-90%
5,447
9,625
5,356
9,582
90-95%
6,725
12,430
6,638
12,399
95-100%
10,581
20,846
10,501
20,824
All classes
3,860
6,521
3,773
6,459
*Imputation includes quantity of consumption for a number of items, received and consumed free of cost through various social welfare programmes.
Based on the above consumption expenditure survey, a State Bank of India report stated that rural poverty was 7.2% and urban poverty was 4.6% in 2022-23 with a new consumption expenditure-based poverty line for India of Rs 1,622 per person per month for rural areas and Rs 1,929 per person per month for urban areas in India based on the recommendations of the Suresh Tendulkar committee.[108][109]
Semi-economic measures of poverty
Other measures such as the semi-economic Multi-dimensional Poverty Index (MPI), which places 33% weight on education and number of schooling years in its definition of poverty, and places 6.25% weight on income and assets owned, suggests there were 650 million people (53.7% of population) living in MPI-poverty in India.[6] 421 million of MPI-defined poor are concentrated in eight North Indian and East Indian states of Bihar, Chhattisgarh, Jharkhand, Madhya Pradesh, Orissa, Rajasthan, Uttar Pradesh and West Bengal. The table below presents this semi-economic poverty among the states of India based on the Multi-dimensional Poverty Index, using a small sample survey data for Indian states in 2005.[110]
According to a 2011 poverty Development Goals Report, as many as 320 million people in India and China are expected to come out of extreme poverty in the next four years, with India's poverty rate projected to drop from 51% in 1990 to about 22% in 2015.[111] The report also indicates that in Southern Asia, only India is on track to cut poverty by half by the 2015 target date.[111] In 2015, according to United Nations Millennium Development Goals (MGD) programme, India has already achieved the target of reducing poverty by half, with 24.7% of its 1.2 billion people in 2011 living below the poverty line or having income of less than $1.25 a day, the U.N. report said. The same figure was 49.4% in 1994. India had set a target of 23.9% to be achieved by 2015.[112]
According to Global Wealth Report 2016[113] compiled by Credit Suisse Research Institute, India is the second most unequal country in the world with the top one per cent of the population owning 58% of the total wealth.[114]
According to the World Food Programme, around 21.25% of India's population live on less than US$1.90 a day. The WFP also says that India is home to a quarter of the world's undernourished people.[115]
Global Hunger Index
Global Hunger Index (GHI) is an index that places a third of weight on proportion of the population that is estimated to be undernourished, a third on the estimated prevalence of low body weight to height ratio in children younger than five, and remaining third weight on the proportion of children dying before the age of five for any reason. According to 2011 GHI report, India has improved its performance by 22% in 20 years, from 30.4 to 23.7 over 1990 to 2011 period.[116] However, its performance from 2001 to 2011 has shown little progress, with just 3% improvement. A sharp reduction in the percentage of underweight children has helped India improve its hunger record on the Global Hunger Index (GHI) 2014. India now ranks 55 among 76 emerging economies. Between 2005 and 2014, the prevalence of underweight children under the age of five fell from 43.5% to 30.7%.[117]
Poverty: 2011–2012 Percentage of people by Caste[118]
Findings below are based on a survey conducted during 2011–12. Total population of India then: 1,276,267,631
From the above 2 tables, we could derive the following to see if the distribution of poverty follows as that of the total population:
Caste
% of total population
Poverty% over poverty population
FC
28.0%
15.9%
OBC
44.1%
41.4%
SC
19.0%
25.3%
ST
8.9%
17.4%
Poverty in India based on Social and Religious Classes: The Sachar Committee looked at the Poverty by Social and Religious Classes[119]
Social and Religious Class
Percentage of Living in Poverty
Urban Hindus
20.4%
Urban Hindu General
8.3%
Urban Hindu OBC
25.1%
Urban Hindu SC/ST
36.4%
Urban Muslims
38.4%
Urban Other Minorities
12.2%
Rural Hindus
22.6%
Rural Hindu General
9.0%
Rural Hindu OBC
19.5%
Rural Hindu SC/ST
34.8%
Rural Muslims
26.9%
Rural Other Minorities
14.3%
Economic impact of British imperialism
The subject of the economic impact of British imperialism on India was raised by British Whig politician Edmund Burke who in 1778 began a seven-year impeachment trial against Warren Hastings and the East India Company on charges including mismanagement of the Indian economy. Contemporary historian Rajat Kanta Ray argues the economy established by the British in the 18th century was a form of plunder and a catastrophe for the traditional economy of India, depleting food and money stocks and imposing high taxes that helped cause the famine of 1770, which killed a third of the people of Bengal.[120]
Since the 1950s, the Indian government and non-governmental organisations have initiated several programs to alleviate poverty, including subsidising food and other necessities, increased access to loans, improving agricultural techniques and price supports, promoting education, and family planning. These measures have helped eliminate famines, cut absolute poverty levels by more than half, and reduced illiteracy and malnutrition.
Although the Indian economy has grown steadily over the last two decades, its growth has been uneven when comparing social groups, economic groups, geographic regions, and rural and urban areas.[121][122] For the year 2015–16, the GSDP growth rates of Andhra Pradesh, Bihar and Madhya Pradesh was higher than Maharashtra, Odisha or Punjab.[123] Though GDP growth rate matters a lot economically, the debate is moving towards another consensus in India, where unhealthy infatuation with GDP growth matters less and holistic development or all-inclusive growth matters more.[124] While India may well be on the path to eradicating extreme poverty, it still lags well behind in other important development indicators, even in comparison to some of its neighbouring countries, especially in regard to health and education.[125]
Despite significant economic progress, one quarter of the nation's population earns less than the government-specified poverty threshold of ₹32 per day (approximately US$ 0.6).[126]
According to the 2001 census, 35.5% of Indian households used banking services, 35.1% owned a radio or transistor, 31.6% a television, 9.1% a phone, 43.7% a bicycle, 11.7% a scooter, motorcycle or a moped, and 2.5% a car, jeep or van; 34.5% of the households had none of these assets.[127] As part of creating the capacity to give access to individuals who are still outside the scope of financial services, Confederation of Indian Industry's president Sanjiv Bajaj called for additional new banks and non-banking financial companies.[128]
According to Department of Telecommunications of India, the phone density reached 73.34% by December 2012 and as an annual growth decreased by −4.58%.[129] This tallies with the fact that a family of four with an annual income of ₹137,000 (US$1,700) could afford some of these luxury items.
The World Bank's Global Monitoring Report for 2014–15 on the Millennium Development Goals says India has been the biggest contributor to poverty reduction between 2008 and 2011, with around 140 million or so lifted out of absolute poverty.[130] On July 17, 2023, a NITI Aayog report highlighted that 13.5 crore People were lifted out of multidimensional poverty between 2015–16 and 2019–21. The report was developed using the most recent data from National Family Health Survey conducted between 2019 and 2021 and represents the second iteration of the National Multidimensional Poverty Index.[131] Since the early 1950s, the Indian government has initiated various schemes to help the poor attain self-sufficiency in food production. A few examples of these initiatives include ration cards and price controls over the supply of basic commodities, particularly food at controlled prices, available throughout the country. These efforts prevented famines, but did little to eliminate or reduce poverty in rural or urban areas between 1950 and 1980.[132]
India's rapid economic growth rate since 1991 is one of the main reasons for a record decline in poverty.[22][23][133] Another reason proposed is India's launch of social welfare programs such as the Mahatma Gandhi National Rural Employment Guarantee Act (MGNREGA) and the Midday Meal Scheme in government schools.[134] In a 2012 study, Klonner and Oldiges, concluded that MGNREGA helps reduce rural poverty gap (intensity of rural poverty) and seasonal poverty, but not overall poverty.[135][136] However, there is a disturbing side, as deprivation has tended to increase, and that too among the most deprived sections. According to the latest statistics published by the Census of India, among scheduled tribes, 44.7% of people were farmers working on their own land in 2001; however, this number came down to 34.5% in 2011. Among scheduled castes, this number declined from 20% to 14.8% during the same period. This data is corroborated by other data from the census, which also says that the number of people who were working on others' land (landless laborers), increased from 36.9% in 2001 to 44.4% among scheduled castes SC and from 45.6% to 45.9% among scheduled tribes.[137]
India has achieved annual growth exceeding 7 percent over the last 15 years and continues to pull millions of people out of poverty, according to the World Bank. The country has halved its poverty rate over the past three decades and has seen strong improvements in most human development outcomes, a report by the international financial institution has found. Growth is expected to continue and the elimination of extreme poverty in the next decade is within reach, said the bank, which warned that the country's development trajectory faces considerable challenges.[138]
UN
According to a United Nations report on 12 July 2023, India lifted approximately 415 million individuals out of poverty between 2005/2006 and 2019/2021. The United Nations reported that 25 nations, including India, achieved a remarkable milestone by reducing their global MPI (Multidimensional Poverty Index) values by half within a span of 15 years. Additionally, the report highlighted that India experienced a reduction in deprivation across all indicators, with notable progress seen among the most impoverished states and marginalised populations, including children and disadvantaged caste groups.[139]
Extreme poverty is the most severe type of poverty, defined by the United Nations (UN) as "a condition characterized by severe deprivation of basic human needs, including food, safe drinking water, sanitation facilities, health, shelter, education and information. It depends not only on income but also on access to services". Historically, other definitions have been proposed within the United Nations.
Poverty is a state or condition in which one lacks the financial resources and essentials for a certain standard of living. Poverty can have diverse environmental, legal, social, economic, and political causes and effects. When evaluating poverty in statistics or economics there are two main measures: absolute poverty compares income against the amount needed to meet basic personal needs, such as food, clothing, and shelter; relative poverty measures when a person cannot meet a minimum level of living standards, compared to others in the same time and place. The definition of relative poverty varies from one country to another, or from one society to another.
The poverty threshold, poverty limit, poverty line, or breadline is the minimum level of income deemed adequate in a particular country. The poverty line is usually calculated by estimating the total cost of one year's worth of necessities for the average adult. The cost of housing, such as the rent for an apartment, usually makes up the largest proportion of this estimate, so economists track the real estate market and other housing cost indicators as a major influence on the poverty line. Individual factors are often used to account for various circumstances, such as whether one is a parent, elderly, a child, married, etc. The poverty threshold may be adjusted annually. In practice, like the definition of poverty, the official or common understanding of the poverty line is significantly higher in developed countries than in developing countries.
The standard of living in India varies from state to state. In 2021, extreme poverty was reduced to 0.8% and India is no longer the nation with the largest population living in poverty.
The economy of India has transitioned from a mixed planned economy to a mixed middle-income developing social market economy with notable public sector in strategic sectors. It is the world's fifth-largest economy by nominal GDP and the third-largest by purchasing power parity (PPP); on a per capita income basis, India ranked 136th by GDP (nominal) and 125th by GDP (PPP). From independence in 1947 until 1991, successive governments followed the Soviet model and promoted protectionist economic policies, with extensive Sovietization, state intervention, demand-side economics, natural resources, bureaucrat driven enterprises and economic regulation. This is characterised as dirigism, in the form of the Licence Raj. The end of the Cold War and an acute balance of payments crisis in 1991 led to the adoption of a broad economic liberalisation in India and indicative planning. Since the start of the 21st century, annual average GDP growth has been 6% to 7%.
Poverty in Pakistan has been recorded by the World Bank at 39.3% using the lower middle-income poverty rate of US$3.2 per day for the fiscal year 2020–21. In September 2021, the government stated that 22% percent of its population lives below the national poverty line set at Rs. 3030 (US$10) per month.
Poverty is measured in different ways by different bodies, both governmental and nongovernmental. Measurements can be absolute, which references a single standard, or relative, which is dependent on context. Poverty is widely understood to be multidimensional, comprising social, natural and economic factors situated within wider socio-political processes.
Income in India discusses the financial state in India. With rising economic growth and prosperity, India's income is also rising rapidly. As an overview, India's per capita net national income or NNI was around Rs. 98,374 in 2022-23. The per-capita income is a crude indicator of the prosperity of a country. In contrast, the gross national income at constant prices stood at over 128 trillion rupees. The same year, GRI growth rate at constant prices was around 6.6 percent. While GNI and NNI are both indicators for a country's economic performance and welfare, the GNI is related to the GDP or the Gross Domestic Product plus the net receipts from abroad, including wages and salaries, property income, net taxes and subsidies receivable from abroad. On the other hand, the NNI of a country is equal to its GNI net of depreciation.
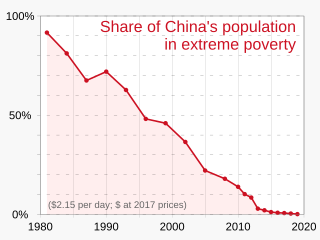
In China today, poverty refers mainly to the rural poor. Decades of economic development has reduced urban extreme poverty. According to the World Bank, more than 850 million Chinese people have been lifted out of extreme poverty; China's poverty rate fell from 88 percent in 1981 to 0.7 percent in 2015, as measured by the percentage of people living on the equivalent of US$1.90 or less per day in 2011 purchasing price parity terms, which still stands in 2022.
The economic liberalisation in India refers to the series of policy changes aimed at opening up the country's economy to the world, with the objective of making it more market-oriented and consumption-driven. The goal was to expand the role of private and foreign investment, which was seen as a means of achieving economic growth and development. Although some attempts at liberalisation were made in 1966 and the early 1980s, a more thorough liberalisation was initiated in 1991.
Below Poverty Line is a benchmark used by the government of India to indicate economic disadvantage and to identify individuals and households in need of government assistance and aid. It is determined using various parameters which vary from state to state and within states. The present criteria are based on a survey conducted in 2002. Going into a survey due for a decade, India's central government is undecided on criteria to identify families below poverty line.
Bangladesh is an under-devoloped nation. Despite rapid economic growth, poverty remains a major issue. However, poverty has declined sharply in recent history. Shortly after its independence, approximately 90% of the population lived under the poverty line. However, since economic reforms and trade liberalization of early 1990s, along with accelerated economic growth since early-2000s, Bangladesh have experienced a dramatic progress in reducing poverty. The remarkable progress in poverty alleviation has been recognized by international institutions. According to World Bank, more than 33 million Bangladeshi people have been lifted out of poverty since 2000; as measured by the percentage of people living on the equivalent of US$1.90 or less per day in 2011 purchasing price parity terms.
Poverty in Sri Lanka is 31% of the population as of June 8, 2023 Sri Lanka's life expectancy and literacy rate are nearly on par with those of developed countries, and even top the rankings for the South Asia region. While all these indicate that Sri Lanka should be experiencing a high standard of living, until recently it has only ranked in the medium category of the Human Development Index (HDI). This is despite the fact that Sri Lanka has been experiencing moderate growth in its GDP averaging 5.5 per annum between 2006 and 2009. One of the reasons is due to its relatively low GDP per capital;. The Sri Lankan government has been successful in reducing poverty from 15.2% on 2006 to 8.9% in 2010, urban poverty was reduced from 6.7 to 5.3% while rural poverty was reduced from 15.7 to 9.5%, and the nation has made significant progress towards achieving Millennium Development Goals on eradicating extreme poverty and hunger.
The poverty gap index is a measure of the degree of poverty. It is defined as extent to which individuals on average fall below the poverty line, and expresses it as a percentage of the poverty line.
Statistics on unemployment in India had traditionally been collected, compiled and disseminated once every ten years by the Ministry of Labour and Employment (MLE), primarily from sample studies conducted by the National Sample Survey Office. Other than these 5-year sample studies, India had historically not collected monthly, quarterly or yearly nationwide employment and unemployment statistics on a routine basis. In 2016, the Centre for Monitoring Indian Economy, a non-governmental entity based in Mumbai, started sampling and publishing monthly unemployment in India statistics.
In Afghanistan, poverty is widespread in rural and urban areas. However, it has been estimated that poverty in Afghanistan is mainly concentrated in rural areas. It has been estimated that four out of five poor people live in rural areas. In these rural areas, families without enough access to adequate nutrition see many infants and children become stunted, malnourished, and die each year. The regions in Afghanistan where almost half of the inhabitants are poor are the eastern, northeastern, and west-central regions. According to the Afghan government's estimates, 42 percent of the Afghanistan's total population lives below the poverty line. Also, 20 percent of people living just above the poverty line are highly vulnerable to falling into poverty.
Kenya is a upper-middle income economy as of 2024, with kenya's GDP 2024 hitting [[204.6B $]]. This is Due to increasing technology innovation Services. Although Kenya's economy is the largest and most developed in eastern and Central Africa, 16.1% (2023/2024) of its population lives below the international poverty line. This severe poverty is mainly caused by economic inequality, government corruption and health problems. In turn, poverty also worsens these factors. The Kenyan government's efforts to address poverty have received help from international institutions as well. The incident rate of poverty has steadily decreased, as shown by a recent MPI index.
Poverty in Namibia is common with an unemployment rate of 29.9%, poverty incidence of 26.9% and HIV prevalence of 16.9%. Namibia has an economic growth rates averaging 4.3% according to the World Bank, and is one of nine nations in Africa classified by the World Bank as upper center pay. However, income disparity in the country is one of the world's highest with a Gini coefficient of 59.1 in 2015, and there were 3,300 US$ millionaires in 2017.
1 2 3 4 5 T. Roy, London School of Economics, Globalization, Factor Prices and Poverty in Colonial India, Australian Economic History Review, Vol. 47, No. 1, pp. 73–94 (March 2007)
1 2 Murton, Brian (2000), "VI.4: Famine", The Cambridge World History of Food 2, Cambridge, New York, pp. 1411–27
1 2 A Sen (1983), Poverty and Famines: An Essay on Entitlement and Deprivation, Oxford University Press, ISBN978-0198284635
↑ Beitler, Maddie (26 September 2020). "Colonial India: A Legacy of Neglect". ArcGIS StoryMaps. Retrieved 17 March 2022. It is important to note that there has not been a major famine in India since it gained its independence in 1947.
1 2 Bhagwati & Panagariya (2013), Why Growth Matters: How Economic Growth in India Reduced Poverty and the Lessons for Other Developing Countries, Public Affairs, ISBN978-1610393737
↑ Erenstein (2011), Livelihood Assets as a Multidimensional Inverse Proxy for Poverty: A District‐level Analysis of the Indian Indo‐Gangetic Plains, Journal of Human Development and Capabilities, 12(2), pp. 283–302.
↑ Krishna & Shariff (2011), The irrelevance of national strategies? Rural poverty dynamics in states and regions of India, 1993–2005. World Development, 39(4), pp. 533–549.
↑ Chandy, L., & Gertz, G. (2011), Poverty in numbers: The changing state of global poverty from 2005 to 2015, Brookings Institution
↑ Paul, S. (1989), A model of constructing the poverty line, Journal of Development Economics, 30(1), pp. 129–144
↑ Sumner (2004), Economic Well-being and Non-economic Well-being, A Review of the Meaning and Measurement of Poverty, ISBN92-9190-617-4
↑ Appleton (2001), 'The Rich Are Just Like Us, Only Richer': Poverty Functions or Consumption Functions?, Journal of African Economies, 10(4), pp. 433–469.
↑ Reddy (1986), Trends in agricultural wages in some south Indian districts: 1800–1980, Indian Journal of Labour Economics, 28, pp. 307–349
↑ Raychaudhuri (1982), Non-agricultural production: Mughal India, In: T. Raychaudhuri, and I. Habib, (Editors), The Cambridge Economic History of India, Cambridge University Press.
↑ Richard Peet; Michael Watts, eds. (2004). Liberation Ecologies: Environment, Development and Social Movements. London: Routledge. pp.44–49. ISBN978-0415312363.
↑ Rajat Kanta Ray, "Indian Society and the Establishment of British Supremacy, 1765–1818," in The Oxford History of British Empire: vol. 2, The Eighteenth Century ed. by P. J. Marshall, (1998), pp 508–29.
↑ Ravallion & Datt (2002), Why has economic growth been more pro-poor in some states of India than others?, Journal of development economics, 68(2), 381–400
↑ Suman, Santosh Kumar. "Relevance of MGNREGA in India"(PDF). AEBM. 3 (7). Krishi Sanskriti Publications: 781–783. Retrieved 17 March 2022.
This page is based on this Wikipedia article Text is available under the CC BY-SA 4.0 license; additional terms may apply. Images, videos and audio are available under their respective licenses.