Profiling (computer programming)

Last updated

In software engineering, profiling ("program profiling", "software profiling") is a form of dynamic program analysis that measures, for example, the space (memory) or time complexity of a program, the usage of particular instructions, or the frequency and duration of function calls. Most commonly, profiling information serves to aid program optimization, and more specifically, performance engineering.

Contents

Profiling is achieved by instrumenting either the program source code or its binary executable form using a tool called a profiler (or code profiler). Profilers may use a number of different techniques, such as event-based, statistical, instrumented, and simulation methods.

Gathering program events

Profilers use a wide variety of techniques to collect data, including hardware interrupts, code instrumentation, instruction set simulation, operating system hooks, and performance counters.

Use of profilers

Graphical output of the CodeAnalyst profiler CodeAnalyst3.png
Graphical output of the CodeAnalyst profiler

Program analysis tools are extremely important for understanding program behavior. Computer architects need such tools to evaluate how well programs will perform on new architectures. Software writers need tools to analyze their programs and identify critical sections of code. Compiler writers often use such tools to find out how well their instruction scheduling or branch prediction algorithm is performing...

ATOM, PLDI

The output of a profiler may be:

Summary profile information is often shown annotated against the source code statements where the events occur, so the size of measurement data is linear to the code size of the program.
/* ------------ source------------------------- count */              0001            IF X = "A"                      0055 0002                THEN DO                        0003                    ADD 1 to XCOUNT         0032 0004                ELSE 0005            IF X = "B"                      0055
For sequential programs, a summary profile is usually sufficient, but performance problems in parallel programs (waiting for messages or synchronization issues) often depend on the time relationship of events, thus requiring a full trace to get an understanding of what is happening.
The size of a (full) trace is linear to the program's instruction path length, making it somewhat impractical. A trace may therefore be initiated at one point in a program and terminated at another point to limit the output.
This provides the opportunity to switch a trace on or off at any desired point during execution in addition to viewing on-going metrics about the (still executing) program. It also provides the opportunity to suspend asynchronous processes at critical points to examine interactions with other parallel processes in more detail.

A profiler can be applied to an individual method or at the scale of a module or program, to identify performance bottlenecks by making long-running code obvious. [1] A profiler can be used to understand code from a timing point of view, with the objective of optimizing it to handle various runtime conditions [2] or various loads. [3] Profiling results can be ingested by a compiler that provides profile-guided optimization. [4] Profiling results can be used to guide the design and optimization of an individual algorithm; the Krauss matching wildcards algorithm is an example. [5] Profilers are built into some application performance management systems that aggregate profiling data to provide insight into transaction workloads in distributed applications. [6]

History

Performance-analysis tools existed on IBM/360 and IBM/370 platforms from the early 1970s, usually based on timer interrupts which recorded the program status word (PSW) at set timer-intervals to detect "hot spots" in executing code.[ citation needed ] This was an early example of sampling (see below). In early 1974 instruction-set simulators permitted full trace and other performance-monitoring features.[ citation needed ]

Profiler-driven program analysis on Unix dates back to 1973, [7] when Unix systems included a basic tool, prof, which listed each function and how much of program execution time it used. In 1982 gprof extended the concept to a complete call graph analysis. [8]

In 1994, Amitabh Srivastava and Alan Eustace of Digital Equipment Corporation published a paper describing ATOM [9] (Analysis Tools with OM). The ATOM platform converts a program into its own profiler: at compile time, it inserts code into the program to be analyzed. That inserted code outputs analysis data. This technique - modifying a program to analyze itself - is known as "instrumentation".

In 2004 both the gprof and ATOM papers appeared on the list of the 50 most influential PLDI papers for the 20-year period ending in 1999. [10]

Profiler types based on output

Flat profiler

Flat profilers compute the average call times, from the calls, and do not break down the call times based on the callee or the context.

Call-graph profiler

Call graph profilers [8] show the call times, and frequencies of the functions, and also the call-chains involved based on the callee. In some tools full context is not preserved.

Input-sensitive profiler

Input-sensitive profilers [11] [12] [13] add a further dimension to flat or call-graph profilers by relating performance measures to features of the input workloads, such as input size or input values. They generate charts that characterize how an application's performance scales as a function of its input.

Data granularity in profiler types

Profilers, which are also programs themselves, analyze target programs by collecting information on their execution. Based on their data granularity, on how profilers collect information, they are classified into event based or statistical profilers. Profilers interrupt program execution to collect information, which may result in a limited resolution in the time measurements, which should be taken with a grain of salt. Basic block profilers report a number of machine clock cycles devoted to executing each line of code, or a timing based on adding these together; the timings reported per basic block may not reflect a difference between cache hits and misses. [14] [15]

Event-based profilers

The programming languages listed here have event-based profilers:

Statistical profilers

Some profilers operate by sampling. A sampling profiler probes the target program's call stack at regular intervals using operating system interrupts. Sampling profiles are typically less numerically accurate and specific, but allow the target program to run at near full speed.

The resulting data are not exact, but a statistical approximation. "The actual amount of error is usually more than one sampling period. In fact, if a value is n times the sampling period, the expected error in it is the square-root of n sampling periods." [16]

In practice, sampling profilers can often provide a more accurate picture of the target program's execution than other approaches, as they are not as intrusive to the target program, and thus don't have as many side effects (such as on memory caches or instruction decoding pipelines). Also since they don't affect the execution speed as much, they can detect issues that would otherwise be hidden. They are also relatively immune to over-evaluating the cost of small, frequently called routines or 'tight' loops. They can show the relative amount of time spent in user mode versus interruptible kernel mode such as system call processing.

Still, kernel code to handle the interrupts entails a minor loss of CPU cycles, diverted cache usage, and is unable to distinguish the various tasks occurring in uninterruptible kernel code (microsecond-range activity).

Dedicated hardware can go beyond this: ARM Cortex-M3 and some recent MIPS processors JTAG interface have a PCSAMPLE register, which samples the program counter in a truly undetectable manner, allowing non-intrusive collection of a flat profile.

Some commonly used [17] statistical profilers for Java/managed code are SmartBear Software's AQtime [18] and Microsoft's CLR Profiler. [19] Those profilers also support native code profiling, along with Apple Inc.'s Shark (OSX), [20] OProfile (Linux), [21] Intel VTune and Parallel Amplifier (part of Intel Parallel Studio), and Oracle Performance Analyzer, [22] among others.

Instrumentation

This technique effectively adds instructions to the target program to collect the required information. Note that instrumenting a program can cause performance changes, and may in some cases lead to inaccurate results and/or heisenbugs. The effect will depend on what information is being collected, on the level of timing details reported, and on whether basic block profiling is used in conjunction with instrumentation. [23] For example, adding code to count every procedure/routine call will probably have less effect than counting how many times each statement is obeyed. A few computers have special hardware to collect information; in this case the impact on the program is minimal.

Instrumentation is key to determining the level of control and amount of time resolution available to the profilers.

Interpreter instrumentation

Hypervisor/simulator

See also

Related Research Articles

In computing, a compiler is a computer program that translates computer code written in one programming language into another language. The name "compiler" is primarily used for programs that translate source code from a high-level programming language to a low-level programming language to create an executable program.

In computing, an optimizing compiler is a compiler that tries to minimize or maximize some attributes of an executable computer program. Common requirements are to minimize a program's execution time, memory footprint, storage size, and power consumption.

In computer science, program analysis is the process of automatically analyzing the behavior of computer programs regarding a property such as correctness, robustness, safety and liveness. Program analysis focuses on two major areas: program optimization and program correctness. The first focuses on improving the program’s performance while reducing the resource usage while the latter focuses on ensuring that the program does what it is supposed to do.

In computing, just-in-time (JIT) compilation is compilation during execution of a program rather than before execution. This may consist of source code translation but is more commonly bytecode translation to machine code, which is then executed directly. A system implementing a JIT compiler typically continuously analyses the code being executed and identifies parts of the code where the speedup gained from compilation or recompilation would outweigh the overhead of compiling that code.

<span class="mw-page-title-main">Valgrind</span> Programming tool for profiling, memory debugging and memory leak detection

Valgrind is a programming tool for memory debugging, memory leak detection, and profiling.

In compiler theory, dead-code elimination is a compiler optimization to remove dead code. Removing such code has several benefits: it shrinks program size, an important consideration in some contexts, it reduces resource usage such as the number of bytes to be transferred and it allows the running program to avoid executing irrelevant operations, which reduces its running time. It can also enable further optimizations by simplifying program structure. Dead code includes code that can never be executed, and code that only affects dead variables, that is, irrelevant to the program.

In compiler optimization, register allocation is the process of assigning local automatic variables and expression results to a limited number of processor registers.

SIGPLAN is the Association for Computing Machinery's Special Interest Group on programming languages.

Dynamic program analysis is analysis of computer software that involves executing the program in question. Dynamic program analysis includes familiar techniques from software engineering such as unit testing, debugging, and measuring code coverage, but also includes lesser-known techniques like program slicing and invariant inference. Dynamic program analysis is widely applied in security in the form of runtime memory error detection, fuzzing, dynamic symbolic execution, and taint tracking.

Thread Level Speculation (TLS), also known as Speculative Multi-threading, or Speculative Parallelization, is a technique to speculatively execute a section of computer code that is anticipated to be executed later in parallel with the normal execution on a separate independent thread. Such a speculative thread may need to make assumptions about the values of input variables. If these prove to be invalid, then the portions of the speculative thread that rely on these input variables will need to be discarded and squashed. If the assumptions are correct the program can complete in a shorter time provided the thread was able to be scheduled efficiently.

In the context of computer programming, instrumentation refers to the measure of a product's performance, in order to diagnose errors and to write trace information. Instrumentation can be of two types: source instrumentation and binary instrumentation.

Gprof is a performance analysis tool for Unix applications. It used a hybrid of instrumentation and sampling and was created as an extended version of the older "prof" tool. Unlike prof, gprof is capable of limited call graph collecting and printing.

Profile-guided optimization, also known as profile-directed feedback (PDF), and feedback-directed optimization (FDO) is a compiler optimization technique in computer programming that uses profiling to improve program runtime performance.
<span class="mw-page-title-main">Incremental computing</span> Software feature

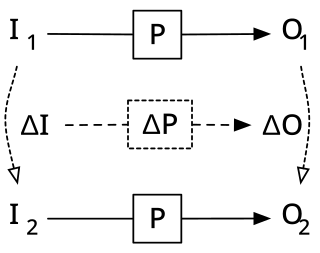
Incremental computing, also known as incremental computation, is a software feature which, whenever a piece of data changes, attempts to save time by only recomputing those outputs which depend on the changed data. When incremental computing is successful, it can be significantly faster than computing new outputs naively. For example, a spreadsheet software package might use incremental computation in its recalculation feature, to update only those cells containing formulas which depend on the changed cells.

In computer science, empirical algorithmics is the practice of using empirical methods to study the behavior of algorithms. The practice combines algorithm development and experimentation: algorithms are not just designed, but also implemented and tested in a variety of situations. In this process, an initial design of an algorithm is analyzed so that the algorithm may be developed in a stepwise manner.

In computer programming and software development, debugging is the process of finding and resolving bugs within computer programs, software, or systems.

Pin is a platform for creating analysis tools. A pin tool comprises instrumentation, analysis and callback routines. Instrumentation routines are called when code that has not yet been recompiled is about to be run, and enable the insertion of analysis routines. Analysis routines are called when the code associated with them is run. Callback routines are only called when specific conditions are met, or when a certain event has occurred. Pin provides an extensive application programming interface (API) for instrumentation at different abstraction levels, from one instruction to an entire binary module. It also supports callbacks for many events such as library loads, system calls, signals/exceptions and thread creation events.

Tracing just-in-time compilation is a technique used by virtual machines to optimize the execution of a program at runtime. This is done by recording a linear sequence of frequently executed operations, compiling them to native machine code and executing them. This is opposed to traditional just-in-time (JIT) compilers that work on a per-method basis.

<span class="mw-page-title-main">DynamoRIO</span> Software framework

DynamoRIO is a BSD-licensed dynamic binary instrumentation framework for the development of dynamic program analysis tools. DynamoRIO targets user space applications under the Android, Linux, and Windows operating systems running on the AArch32, IA-32, and x86-64 instruction set architectures.

References

  1. "How to find the performance bottleneck in C# desktop application?". Stack Overflow. 2012.
  2. Krauss, Kirk J (2017). "Performance Profiling with a Focus". Develop for Performance.
  3. "What is code profiling? Learn the 3 Types of Code Profilers". Stackify Developer Tips, Tricks and Resources. Disqus. 2016.
  4. Lawrence, Eric (2016). "Getting Started with Profile Guided Optimization". testslashplain. WordPress.
  5. Krauss, Kirk (2018). "Matching Wildcards: An Improved Algorithm for Big Data". Develop for Performance.
  6. "List of .Net Profilers: 3 Different Types and Why You Need All of Them". Stackify Developer Tips, Tricks and Resources. Disqus. 2016.
  7. Unix Programmer's Manual, 4th Edition
  8. 1 2 S.L. Graham, P.B. Kessler, and M.K. McKusick, gprof: a Call Graph Execution Profiler, Proceedings of the SIGPLAN '82 Symposium on Compiler Construction, SIGPLAN Notices, Vol. 17, No 6, pp. 120-126; doi:10.1145/800230.806987
  9. A. Srivastava and A. Eustace, ATOM: A system for building customized program analysis tools, Proceedings of the ACM SIGPLAN Conference on Programming language design and implementation (PLDI '94), pp. 196-205, 1994; ACM SIGPLAN Notices - Best of PLDI 1979-1999 Homepage archive, Vol. 39, No. 4, pp. 528-539; doi:10.1145/989393.989446
  10. 20 Years of PLDI (1979–1999): A Selection, Kathryn S. McKinley, Editor
  11. E. Coppa, C. Demetrescu, and I. Finocchi, Input-Sensitive Profiling, IEEE Trans. Software Eng. 40(12): 1185-1205 (2014); doi:10.1109/TSE.2014.2339825
  12. D. Zaparanuks and M. Hauswirth, Algorithmic Profiling, Proceedings of the 33rd ACM SIGPLAN Conference on Programming Language Design and Implementation (PLDI 2012), ACM SIGPLAN Notices, Vol. 47, No. 6, pp. 67-76, 2012; doi:10.1145/2254064.2254074
  13. T. Kustner, J. Weidendorfer, and T. Weinzierl, Argument Controlled Profiling, Proceedings of Euro-Par 2009 – Parallel Processing Workshops, Lecture Notes in Computer Science, Vol. 6043, pp. 177-184, 2010; doi:10.1007/978-3-642-14122-5 22
  14. "Timing and Profiling - Basic Block Profilers". OpenStax CNX Archive.
  15. Ball, Thomas; Larus, James R. (1994). "Optimally profiling and tracing programs" (PDF). ACM Transactions on Programming Languages and Systems. ACM Digital Library. 16 (4): 1319–1360. doi:10.1145/183432.183527. S2CID   6897138. Archived from the original (PDF) on 2018-05-18. Retrieved 2018-05-18.
  16. Statistical Inaccuracy of gprof Output Archived 2012-05-29 at the Wayback Machine
  17. "Popular C# Profilers". Gingtage. 2014.
  18. "Sampling Profiler - Overview". AQTime 8 Reference. SmartBear Software. 2018.
  19. Wenzal, Maira; et al. (2017). "Profiling Overview". Microsoft .NET Framework Unmanaged API Reference. Microsoft.
  20. "Performance Tools". Apple Developer Tools . Apple, Inc. 2013.
  21. Netto, Zanella; Arnold, Ryan S. (2012). "Evaluate performance for Linux on Power". IBM DeveloperWorks .
  22. Schmidl, Dirk; Terboven, Christian; an Mey, Dieter; Müller, Matthias S. (2013). Suitability of Performance Tools for OpenMP Task-Parallel Programs. Proc. 7th Int'l Workshop on Parallel Tools for High Performance Computing. pp. 25–37. ISBN   9783319081441.
  23. Carleton, Gary; Kirkegaard, Knud; Sehr, David (1998). "Profile-Guided Optimizations". Dr. Dobb's Journal .