
gnuplot is a command-line and GUI program that can generate two- and three-dimensional plots of functions, data, and data fits. The program runs on all major computers and operating systems . Originally released in 1986, its listed authors are Thomas Williams, Colin Kelley, Russell Lang, Dave Kotz, John Campbell, Gershon Elber, Alexander Woo "and many others." Despite its name, this software is not part of the GNU Project.
In computing, cross-platform software is computer software that is designed to work in several computing platforms. Some cross-platform software requires a separate build for each platform, but some can be directly run on any platform without special preparation, being written in an interpreted language or compiled to portable bytecode for which the interpreters or run-time packages are common or standard components of all supported platforms.
Irrlicht is an open-source game engine written in C++. It is cross-platform, officially running on Windows, macOS, Linux and Windows CE and due to its open nature ports to other systems are available, including FreeBSD, Xbox, PlayStation Portable, Symbian, iPhone, AmigaOS 4, Sailfish OS via a QT/Qml wrapper, and Google Native Client.

In mathematics, a time series is a series of data points indexed in time order. Most commonly, a time series is a sequence taken at successive equally spaced points in time. Thus it is a sequence of discrete-time data. Examples of time series are heights of ocean tides, counts of sunspots, and the daily closing value of the Dow Jones Industrial Average.

ROOT is an object-oriented computer program and library developed by CERN. It was originally designed for particle physics data analysis and contains several features specific to the field, but it is also used in other applications such as astronomy and data mining. The latest minor release is 6.28, as of 2023-02-03.
A GIS software program is a computer program to support the use of a geographic information system, providing the ability to create, store, manage, query, analyze, and visualize geographic data, that is, data representing phenomena for which location is important. The GIS software industry encompasses a broad range of commercial and open-source products that provide some or all of these capabilities within various information technology architectures.

PyMOL is an open source but proprietary molecular visualization system created by Warren Lyford DeLano. It was commercialized initially by DeLano Scientific LLC, which was a private software company dedicated to creating useful tools that become universally accessible to scientific and educational communities. It is currently commercialized by Schrödinger, Inc. As the original software license was a permissive licence, they were able to remove it; new versions are no longer released under the Python license, but under a custom license, and some of the source code is no longer released. PyMOL can produce high-quality 3D images of small molecules and biological macromolecules, such as proteins. According to the original author, by 2009, almost a quarter of all published images of 3D protein structures in the scientific literature were made using PyMOL.

LabPlot is a free software cross-platform computer program for interactive scientific graphing and data analysis, written mainly for the KDE desktop for Unix-like operating systems, and later available for Microsoft Windows. It is similar to Origin, and is able to import Origin's data files.

Ploticus is a free, open-source (GPL) computer program for producing plots and charts from data. It runs under Unix, Solaris, Mac OS X, Linux and Win32 systems. Community support is customarily done through Yahoo News Groups.
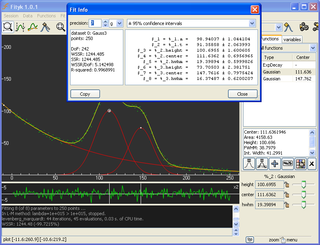
Fityk is curve fitting and data analysis application, predominantly used to fit analytical, bell-shaped functions to experimental data. It is positioned to fill the gap between general plotting software and programs specific for one field, e.g. crystallography or XPS.

SageMath is a computer algebra system (CAS) with features covering many aspects of mathematics, including algebra, combinatorics, graph theory, group theory, differentiable manifolds, numerical analysis, number theory, calculus and statistics.

Origin is a proprietary computer program for interactive scientific graphing and data analysis. It is produced by OriginLab Corporation, and runs on Microsoft Windows. It has inspired several platform-independent open-source clones and alternatives like LabPlot and SciDAVis.
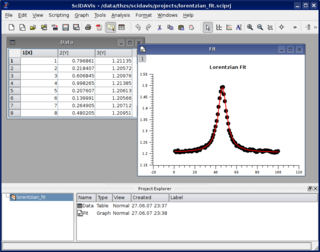
SciDAVis is an open-source cross-platform computer program for interactive scientific graphing and data analysis. Development started in 2007 as fork of QtiPlot, which in turn is a clone of the proprietary program Origin.

Veusz is a scientific plotting package. Veusz is a Qt application written in Python, PyQt and NumPy. It is freely available for anyone to distribute under the terms of the GPL. It is designed to produce publication-quality plots. The name should be pronounced as "views".

DataScene is a scientific graphing, animation, data analysis, and real-time data monitoring software package. It was developed with the Common Language Infrastructure technology and the GDI+ graphics library. With the two Common Language Runtime engines - the .Net and Mono frameworks - DataScene runs on all major operating systems.
