Related Research Articles

gnuplot is a command-line and GUI program that can generate two- and three-dimensional plots of functions, data, and data fits. The program runs on all major computers and operating systems . Originally released in 1986, its listed authors are Thomas Williams, Colin Kelley, Russell Lang, Dave Kotz, John Campbell, Gershon Elber, Alexander Woo "and many others." Despite its name, this software is not part of the GNU Project.

SPSS Statistics is a statistical software suite developed by IBM for data management, advanced analytics, multivariate analysis, business intelligence, and criminal investigation. Long produced by SPSS Inc., it was acquired by IBM in 2009. Versions of the software released since 2015 have the brand name IBM SPSS Statistics.

In mathematics, a time series is a series of data points indexed in time order. Most commonly, a time series is a sequence taken at successive equally spaced points in time. Thus it is a sequence of discrete-time data. Examples of time series are heights of ocean tides, counts of sunspots, and the daily closing value of the Dow Jones Industrial Average.
In the statistical analysis of time series, autoregressive–moving-average (ARMA) models provide a parsimonious description of a (weakly) stationary stochastic process in terms of two polynomials, one for the autoregression (AR) and the second for the moving average (MA). The general ARMA model was described in the 1951 thesis of Peter Whittle, Hypothesis testing in time series analysis, and it was popularized in the 1970 book by George E. P. Box and Gwilym Jenkins.
gretl is an open-source statistical package, mainly for econometrics. The name is an acronym for GnuRegression, Econometrics and Time-seriesLibrary.
In statistics and econometrics, and in particular in time series analysis, an autoregressive integrated moving average (ARIMA) model is a generalization of an autoregressive moving average (ARMA) model. To better comprehend the data or to forecast upcoming series points, both of these models are fitted to time series data. ARIMA models are applied in some cases where data show evidence of non-stationarity in the sense of mean, where an initial differencing step can be applied one or more times to eliminate the non-stationarity of the mean function. When the seasonality shows in a time series, the seasonal-differencing could be applied to eliminate the seasonal component. Since the ARMA model, according to the Wold's decomposition theorem, is theoretically sufficient to describe a regular wide-sense stationary time series, we are motivated to make stationary a non-stationary time series, e.g., by using differencing, before we can use the ARMA model. Note that if the time series contains a predictable sub-process, the predictable component is treated as a non-zero-mean but periodic component in the ARIMA framework so that it is eliminated by the seasonal differencing.

Stata is a general-purpose statistical software package developed by StataCorp for data manipulation, visualization, statistics, and automated reporting. It is used by researchers in many fields, including biomedicine, economics, epidemiology, and sociology.
EViews is a statistical package for Windows, used mainly for time-series oriented econometric analysis. It is developed by Quantitative Micro Software (QMS), now a part of IHS. Version 1.0 was released in March 1994, and replaced MicroTSP. The TSP software and programming language had been originally developed by Robert Hall in 1965. The current version of EViews is 13, released in August 2022.
Origin is a proprietary computer program for interactive scientific graphing and data analysis. It is produced by OriginLab Corporation, and runs on Microsoft Windows. It has inspired several platform-independent open-source clones and alternatives like LabPlot and SciDAVis.
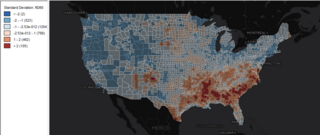
GeoDa is a free software package that conducts spatial data analysis, geovisualization, spatial autocorrelation and spatial modeling.
FlexPro is a proprietary software package for analysis and presentation of scientific and technical data, produced by Weisang GmbH. It runs on Microsoft Windows and is available in English, German, Japanese, Chinese and French. FlexPro has its roots in the test and measurement domain and supports different binary file formats of data acquisition instruments and software. In particular, FlexPro can analyze large amounts of data with high sampling rates.
Dap is a statistics and graphics program based on the C programming language that performs data management, analysis, and C-style graphical visualization tasks without requiring complex syntax. Its name is an acronym for Data Analysis and Presentation.
Chronux is an open-source software package developed for the loading, visualization and analysis of a variety of modalities / formats of neurobiological time series data. Usage of this tool enables neuroscientists to perform a variety of analysis on multichannel electrophysiological data such as LFP, EEG, MEG, Neuronal spike times and also on spatiotemporal data such as FMRI and dynamic optical imaging data. The software consists of a set of MATLAB routines interfaced with C libraries that can be used to perform the tasks that constitute a typical study of neurobiological data. These include local regression and smoothing, spike sorting and spectral analysis - including multitaper spectral analysis, a powerful nonparametric method to estimate power spectrum. The package also includes some GUIs for time series visualization and analysis. Chronux is GNU GPL v2 licensed.
Rattle GUI is a free and open source software package providing a graphical user interface (GUI) for data mining using the R statistical programming language. Rattle is used in a variety of situations. Currently there are 15 different government departments in Australia, in addition to various other organisations around the world, which use Rattle in their data mining activities and as a statistical package.
SHAZAM is a comprehensive econometrics and statistics package for estimating, testing, simulating and forecasting many types of econometrics and statistical models. SHAZAM was originally created in 1977 by Kenneth White.
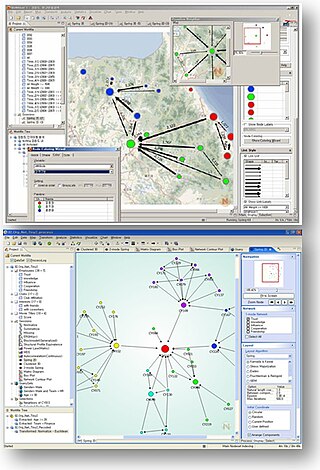
NetMiner is an application software for exploratory analysis and visualization of large network data based on SNA. It can be used for general research and teaching in social networks. This tool allows researchers to explore their network data visually and interactively, helps them to detect underlying patterns and structures of the network. It features data transformation, network analysis, statistics, visualization of network data, chart, and a programming language based on the Python script language. Also, it enables users to import unstructured text data(e.g. news, articles, tweets, etc.) and extract words and network from text data. In addition, NetMiner SNS Data Collector, an extension of NetMiner, can collect some social networking service(SNS) data with a few clicks.

LIMDEP is an econometric and statistical software package with a variety of estimation tools. In addition to the core econometric tools for analysis of cross sections and time series, LIMDEP supports methods for panel data analysis, frontier and efficiency estimation and discrete choice modeling. The package also provides a programming language to allow the user to specify, estimate and analyze models that are not contained in the built in menus of model forms.
Apache Spark is an open-source unified analytics engine for large-scale data processing. Spark provides an interface for programming clusters with implicit data parallelism and fault tolerance. Originally developed at the University of California, Berkeley's AMPLab, the Spark codebase was later donated to the Apache Software Foundation, which has maintained it since.
References
- ↑ "The RATS letter Volume 32, No. 1" (PDF). Retrieved 2024-01-15.
- ↑ Renfro, Charles G. (2004). Computational Econometrics: Its Impact on the Development of Quantitative Economics. IOS Press. p. 36. ISBN 1-58603-426-X.
- ↑ Ooms, Marius; Doornik, Jurgen A. (2006). "Econometric software development: past, present and future". Statistica Neerlandica. 60 (2): 206–224. doi:10.1111/j.1467-9574.2006.00317.x.