Texas's 13th congressional district

Last updated

Texas's 13th congressional district
Texas US Congressional District 13 (since 2021).tif
Texas's 13th congressional district since January 3, 2023.
Representative
  Ronny Jackson
RAmarillo
Distribution
  • 68.88% urban
  • 31.12% rural
Population (2022)776,421 [1] [2]
Median household
income
$64,369 [2]
Ethnicity
Cook PVI R+26 [3]

Texas's 13th congressional district is a congressional district in the U.S. state of Texas that includes most of the Texas Panhandle, parts of Texoma and northwestern parts of North Texas. The principal cities in the district are Amarillo, Gainesville and Wichita Falls. [4] It winds across the Panhandle into the South Plains, then runs east across the Red River Valley. Covering over 40,000 square miles (100,000 km2), it is the 19th-largest district by area in the nation, the 14th-largest that does not cover an entire state, as well as the second-largest in Texas behind the 23rd congressional district. It covers more land mass than thirteen entire states. After the 2020 census was completed, the 13th district was heavily redrawn to incorporate Denton, an increasingly Democratic-leaning suburb of the Dallas-Fort Worth metroplex which had previously anchored the 26th district . [5] With a Cook Partisan Voting Index rating of R+26, it is one of the most Republican districts in Texas. [3]

Contents

The district has been represented in the United States House of Representatives by Republican Ronny Jackson since 2021, and previously by Republican Mac Thornberry, from 1995 until his decision not to run for reelection in 2020. [6] As late as 1976, Jimmy Carter won 33 of the 44 counties in the district, getting 60% to 70% of the vote in many of them. While voters in the Panhandle began splitting their tickets as early as the 1940s, Democrats continued to hold most local offices, as well as most of the area's seats in the state legislature, well into the 1990s.

Since Thornberry's ouster of three-term Democrat Bill Sarpalius in 1994, however, a Democrat has only crossed the 30 percent mark in 1996, 1998 and 2000. Republicans now dominate at nearly every level of government, and there are almost no elected Democrats left above the county level. In 2012, Barack Obama took just 18.5% of the vote in the 13th, his lowest percentage of any congressional district in the nation. In 2016, it was Hillary Clinton's second largest margin of defeat in a congressional district after Alabama's 4th . She received an even lower percentage than President Obama four years prior, gathering 16.9% of the vote compared to Donald Trump's 79.9%.

Election results from presidential races

YearOfficeResult
2000 President Bush 68% – 31%
2004 President Bush 78% – 22%
2008 President McCain 77% – 22%
2012 President Romney 80% – 19%
2016 President Trump 80% – 17%
2020 President Trump 80% – 19%

List of members representing the district

MemberPartyTermCong
ress
Election history
District established March 4, 1893
JeremiahVCockrell.jpg
Jeremiah V. Cockrell
(Anson)
Democratic March 4, 1893 –
March 3, 1897
53rd
54th
Elected in 1892.
Re-elected in 1894.
[ data missing ]
John Hall Stephens.jpg
John H. Stephens
(Vernon)
Democratic March 4, 1897 –
March 3, 1917
55th
56th
57th
58th
59th
60th
61st
62nd
63rd
64th
Elected in 1896.
Re-elected in 1898.
Re-elected in 1900.
Re-elected in 1902.
Re-elected in 1904.
Re-elected in 1906.
Re-elected in 1908.
Re-elected in 1910.
Re-elected in 1912.
Re-elected in 1914.
[ data missing ]
John Marvin Jones.jpg
J. Marvin Jones
(Amarillo)
Democratic March 4, 1917 –
March 3, 1919
65th Elected in 1916.
Redistricted to the 18th district .
LucianWParrish.jpg
Lucian W. Parrish
(Henrietta)
Democratic March 4, 1919 –
March 27, 1922
66th
67th
Elected in 1918.
Re-elected in 1920.
Died.
VacantMarch 27, 1922 –
May 22, 1922
67th
Guinn Williams, 1930.jpg
Guinn Williams
(Decatur)
Democratic May 22, 1922 –
March 3, 1933
67th
68th
69th
70th
71st
72nd
Elected to finish Parrish's term.
Re-elected in 1922.
Re-elected in 1924.
Re-elected in 1926.
Re-elected in 1928.
Re-elected in 1930.
[ data missing ]
William D. McFarlane
(Graham)
Democratic March 4, 1933 –
January 3, 1939
73rd
74th
75th
Elected in 1932.
Re-elected in 1934.
Re-elected in 1936.
[ data missing ]
EdGossett.jpg
Ed Gossett
(Wichita Falls)
Democratic January 3, 1939 –
July 31, 1951
76th
77th
78th
79th
80th
81st
82nd
Elected in 1938.
Re-elected in 1940.
Re-elected in 1942.
Re-elected in 1944.
Re-elected in 1946.
Re-elected in 1948.
Re-elected in 1950.
Resigned.
VacantJuly 31, 1951 –
September 8, 1951
82nd
Frank N. Ikard.jpg
Frank N. Ikard
(Wichita Falls)
Democratic September 8, 1951 –
December 15, 1961
82nd
83rd
84th
85th
86th
87th
Elected to finish Gossett's term.
Re-elected in 1952.
Re-elected in 1954.
Re-elected in 1956.
Re-elected in 1958.
Re-elected in 1960.
Resigned.
VacantDecember 15, 1961 –
January 27, 1962
87th
Graham B. Purcell, Jr..jpg
Graham B. Purcell Jr.
(Wichita Falls)
Democratic January 27, 1962 –
January 3, 1973
87th
88th
89th
90th
91st
92nd
Elected to finish Ikard's term.
Re-elected in 1962.
Re-elected in 1964.
Re-elected in 1966.
Re-elected in 1968.
Re-elected in 1970.
Lost reelection after redistricting.
Bob Price.jpg
Bob Price
(Pampa)
Republican January 3, 1973 –
January 3, 1975
93rd Redistricted from the 18th district and re-elected in 1972.
Lost reelection.
Jack English Hightower.jpg
Jack Hightower
(Vernon)
Democratic January 3, 1975 –
January 3, 1985
94th
95th
96th
97th
98th
Elected in 1974.
Re-elected in 1976.
Re-elected in 1978.
Re-elected in 1980.
Re-elected in 1982.
Lost reelection.
Beau Boulter.jpg
Beau Boulter
(Amarillo)
Republican January 3, 1985 –
January 3, 1989
99th
100th
Elected in 1984.
Re-elected in 1986.
Retired to run for U.S. Senator.
Bill Sarpalius.jpg
Bill Sarpalius
(Amarillo)
Democratic January 3, 1989 –
January 3, 1995
101st
102nd
103rd
Elected in 1988.
Re-elected in 1990.
Re-elected in 1992.
Lost reelection.
Mac Thornberry portrait 116th congress (cropped).jpg
Mac Thornberry
(Amarillo)
Republican January 3, 1995 –
January 3, 2021
104th
105th
106th
107th
108th
109th
110th
111th
112th
113th
114th
115th
116th
Elected in 1994.
Reelected in 1996.
Reelected in 1998.
Reelected in 2000.
Reelected in 2002.
Reelected in 2004.
Reelected in 2006.
Reelected in 2008.
Reelected in 2010.
Reelected in 2012.
Reelected in 2014.
Reelected in 2016.
Reelected in 2018.
Retired.
Ronny Jackson 117th U.S Congress.jpg
Ronny Jackson
(Amarillo)
Republican January 3, 2021 –
present
117th
118th
Elected in 2020.
Re-elected in 2022.

Election results

Often in recent years, the incumbent has either run unopposed or has only a third/fourth party candidate who is opposing them. Generally, the incumbent gets over 70% of the vote, even during years with huge opposition party pickups.

Texas 13th congressional district 1994 [7]
PartyCandidateVotes%
Republican Mac Thornberry79,46655.42
Democratic Bill Sarpalius (incumbent)63,92344.58
Total votes143,389 100.00
Texas 13th congressional district 1996 [7]
PartyCandidateVotes%
Republican Mac Thornberry (incumbent)116,09866.87
Democratic Samuel Brown Silverman56,06632.29
Independent Don Harkey1,4630.84
Total votes173,627 100.00
Texas 13th congressional district 1998 [7]
PartyCandidateVotes%
Republican Mac Thornberry (incumbent)81,14167.92
Democratic Mark Harmon37,02730.99
Libertarian Georganne Baker Payne1,2981.09
Total votes119,466 100.00
Texas 13th congressional district 2000 [7]
PartyCandidateVotes%
Republican Mac Thornberry (incumbent)117,99567.63
Democratic Curtis Clinesmith54,34331.15
Libertarian Brad Clardy2,1371.22
Total votes174,475 100.00
Texas 13th congressional district 2002 [7]
PartyCandidateVotes%
Republican Mac Thornberry (incumbent)119,40179.27
Democratic Zane Reese31,21820.73
Total votes150,619 100.00
Texas 13th congressional district 2004 [7]
PartyCandidateVotes%
Republican Mac Thornberry (incumbent)189,44892.31
Libertarian John Robert Deek15,7937.69
Total votes205,241 100.00
Texas 13th congressional district 2006 [7]
PartyCandidateVotes%
Republican Mac Thornberry (incumbent)108,10774.35
Democratic Roger J. Waun33,46023.01
Libertarian Keith Dyer3,8292.63
Total votes145,396 100.00
Texas 13th congressional district 2008 [7]
PartyCandidateVotes%
Republican Mac Thornberry (incumbent)180,07877.65
Democratic Roger James Waun51,84122.35
Total votes231,919 100.00
Texas 13th congressional district 2010 [7]
PartyCandidateVotes%
Republican Mac Thornberry (incumbent)113,20187.05
Independent Keith Dyer11,1928.61
Libertarian John T. Burwell Jr.5,6504.34
Total votes130,043 100.00
Texas 13th congressional district 2012 [7]
PartyCandidateVotes%
Republican Mac Thornberry (incumbent)187,77590.98
Libertarian John Robert Deek12,7016.15
Green Keith F. Houston5,9122.86
Total votes206,388 100.00
Texas 13th congressional district 2014 [7]
PartyCandidateVotes%
Republican Mac Thornberry (incumbent)110,84284.3
Democratic Mike Minter16,82212.8
Libertarian Emily Pivoda2,8632.2
Green Don Cook9240.7
Total votes131,451 100
Texas 13th congressional district 2016 [8]
PartyCandidateVotes%
Republican Mac Thornberry (incumbent)199,05090.0
Libertarian Calvin DeWeese14,7256.7
Green H.F. "Rusty" Tomlinson7,4673.4
Total votes221,242 100
Texas 13th congressional district 2018 [9]
PartyCandidateVotes%
Republican Mac Thornberry (incumbent)168,09081.6
Democratic Greg Sagan34,85916.9
Libertarian Calvin DeWeese3,1441.5
Total votes206,093 100
Texas 13th congressional district 2020
PartyCandidateVotes%
Republican Ronny Jackson217,12479.4
Democratic Gus Trujillo50,47718.5
Libertarian Jack B. Westbrook5,9072.1
Total votes273,508 100
Texas's 13th congressional district 2022
PartyCandidateVotes%
Republican Ronny Jackson (incumbent) 161,767 75.3
Democratic Kathleen Brown52,91024.6
Total votes214,677 100

Historical district boundaries

2007-2013 TX13 109.gif
2007–2013
2013-2023 Texas US Congressional District 13 (since 2013).tif
2013–2023

See also

Related Research Articles

<span class="mw-page-title-main">Mac Thornberry</span> American politician (born 1958)

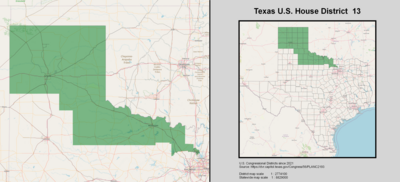
William McClellan "Mac" Thornberry is an American politician who served as the U.S. representative for Texas's 13th congressional district from 1995 to 2021. A member of the Republican Party, Thornberry represented the most Republican district in the United States by partisan voting index. The district covers the Texas Panhandle and stretched between the Oklahoma and New Mexico borders.

<span class="mw-page-title-main">Texas's 6th congressional district</span> U.S. House district for Texas

Texas's 6th congressional district of the United States House of Representatives is in an area that includes Ellis and Navarro counties to the south and southeast of the Dallas/Fort Worth area plus the southeast corner of Tarrant County. As of the 2010 census, the 6th district represented 698,498 people. The district is currently represented by Republican Jake Ellzey.

<span class="mw-page-title-main">Texas's 15th congressional district</span> U.S. House district for Texas

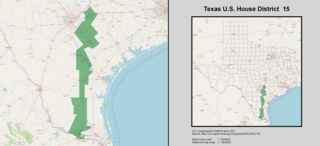
Texas's 15th congressional district of the United States House of Representatives includes a thin section of the far south of the state of Texas. The district's current Representative is Republican Monica De La Cruz. Elected in 2022, de la Cruz is the first Republican and woman to represent the district.

<span class="mw-page-title-main">Texas's 17th congressional district</span> U.S. House district for Texas

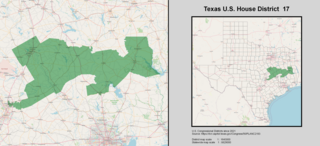
Texas's 17th congressional district of the United States House of Representatives includes a strip of Central Texas and Deep East Texas stretching from Nacogdoches to Waco and Round Rock, including former President George W. Bush's McLennan County ranch. The district is currently represented by Republican Pete Sessions.

<span class="mw-page-title-main">Texas's 26th congressional district</span> U.S. House district for Texas

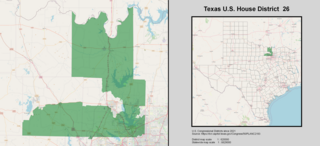
Texas' 26th congressional district of the United States House of Representatives includes rural Cooke County to the north and some of Wise County to the West and includes parts of Denton County, including Flower Mound, Lewisville and parts of Corinth, Carrollton, Little Elm and The Colony. The current Representative is Michael C. Burgess. The district is best known as the seat of former House Majority Leader Dick Armey.

<span class="mw-page-title-main">Florida's 1st congressional district</span> U.S. House district for Florida

Florida's 1st congressional district is a congressional district in the U.S. state of Florida, covering the state's western Panhandle. It includes all of Escambia, Okaloosa, Santa Rosa counties, and portions of Walton county. The district is anchored in Pensacola and also includes the large military bedroom communities and tourist destinations of Navarre and Fort Walton Beach and stretches along the Emerald Coast. The district is currently represented by Republican Matt Gaetz. With a Cook Partisan Voting Index rating of R+19, it is the most Republican district in Florida.

Ohio's 2nd congressional district is a district in southern Ohio. It is currently represented by Republican Brad Wenstrup.

<span class="mw-page-title-main">Nebraska's 2nd congressional district</span> U.S. House district for Nebraska

Nebraska's 2nd congressional district is a congressional district in the U.S. state of Nebraska that encompasses the core of the Omaha–Council Bluffs metropolitan area. It includes all of Douglas County, which includes the state's largest city Omaha; it also includes Saunders County and areas of Western Sarpy County. It has been represented in the United States House of Representatives since 2017 by Don Bacon, a member of the Republican Party. It was one of 18 districts that would have voted for Joe Biden in the 2020 presidential election had they existed in their current configuration while being won or held by a Republican in 2022.

Alabama's 5th congressional district is a U.S. congressional district in Alabama, which elects a representative to the United States House of Representatives. It encompasses the counties of Lauderdale, Limestone, Madison, Morgan and most of Jackson. It is currently represented by Republican Dale Strong, a former Madison County Commissioner. Strong was first elected in 2022 following the retirement of Republican incumbent Mo Brooks.

<span class="mw-page-title-main">New Hampshire's 1st congressional district</span> U.S. House district for New Hampshire

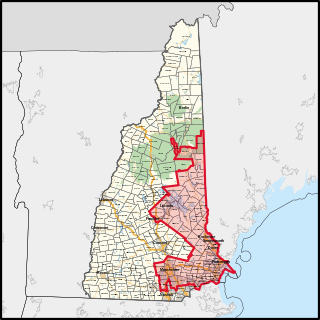
New Hampshire's 1st congressional district covers parts of Southern New Hampshire and the eastern portion of the state. The district contains parts of Hillsborough, Rockingham, Merrimack, Grafton, and Belknap counties; and the entirety of Strafford and Carroll counties.

<span class="mw-page-title-main">South Carolina's 5th congressional district</span> U.S. House district for South Carolina

South Carolina's 5th congressional district is a congressional district in northern South Carolina bordering North Carolina. The district includes all of Cherokee, Chester, Fairfield, Kershaw, Lancaster, Lee, Union and York counties and parts of Newberry, Spartanburg and Sumter counties. The bulk of its population lives on the South Carolina side of the Charlotte metropolitan area, including the rapidly growing cities of Rock Hill, Fort Mill, and Lake Wylie. Outside the Charlotte suburbs, the district is mostly rural and agricultural. The district borders were contracted from some of the easternmost counties in the 2012 redistricting.

Washington's 5th congressional district encompasses the Eastern Washington counties of Ferry, Stevens, Pend Oreille, Lincoln, Spokane, Whitman, Walla Walla, Columbia, Garfield, and Asotin, along with parts of Adams and Franklin. It is centered on Spokane, the state's second largest city.

<span class="mw-page-title-main">Florida's 2nd congressional district</span> U.S. House district for Florida

Florida's 2nd congressional district is a congressional district in the U.S. state of Florida. The district consists of the eastern part of the Florida Panhandle along with much of the Big Bend region along the Emerald Coast. It straddles both the Eastern and Central time zones. It includes Tallahassee, the state capital, and Panama City. With 49% of its residents living in rural areas, it is the least urbanized district in the state, and voters are generally conservative. The district is represented by Republican Neal Dunn of Panama City.

<span class="mw-page-title-main">Arkansas's 3rd congressional district</span> U.S. House district for Arkansas

Arkansas's 3rd congressional district is a congressional district in the U.S. state of Arkansas. The district covers Northwest Arkansas and takes in Fort Smith, Fayetteville, Springdale, and Bentonville.

<span class="mw-page-title-main">New Hampshire's 2nd congressional district</span> U.S. House district for New Hampshire

New Hampshire's 2nd congressional district covers the western, northern, and some southern parts of New Hampshire. It includes the state's second-largest city, Nashua, as well as the state capital, Concord. It is currently represented in the United States House of Representatives by Democrat Ann McLane Kuster.

<span class="mw-page-title-main">Oklahoma's 3rd congressional district</span> U.S. House district for Oklahoma

Oklahoma's 3rd congressional district is the largest congressional district in the state, covering an area of 34,088.49 square miles, over 48 percent the state's land mass. The district is bordered by New Mexico, Colorado, Kansas, and the Texas panhandle. Altogether, the district includes a total of 32 counties, and covers more territory than the state's other four districts combined. It is one of the largest districts in the nation that does not cover an entire state.

Missouri's 7th congressional district consists of Southwest Missouri. The district includes Springfield, the home of Missouri State University, the Joplin, Missouri, metropolitan area, Missouri's 5th largest, and the popular tourist destination city of Branson. Located along the borders of Kansas, Oklahoma, and Northwest Arkansas, the district occupies part of the Bible Belt with a strong socially conservative trend. George W. Bush defeated John Kerry here 67% to 32% in the 2004 election. Republican John McCain defeated Democrat Barack Obama 63.1% to 35.3% in the 2008 election. Republican and Former Massachusetts Governor Mitt Romney defeated Barack Obama 67.6% to 30.3% in the 2012 election. In the 2020 election, Republican Donald Trump defeated Democrat Joe Biden 69.91% to 28.93%. As of 2020, this district is the second most strongly Republican district in Missouri and is one of the most strongly Republican districts in the United States.

Georgia's 7th congressional district is a congressional district in the U.S. state of Georgia. It is currently represented by Democrat Lucy McBath.

<span class="mw-page-title-main">2010 United States House of Representatives elections in Texas</span> 2010 House elections in Texas

The 2010 U.S. congressional elections in Texas were held on November 2, 2010, to determine who will represent the state of Texas in the United States House of Representatives. Representatives are elected for two-year terms; those elected served in the 112th Congress from January 2011 until January 2013.

<span class="mw-page-title-main">1996 United States House of Representatives elections in Texas</span> 1996 House elections in Texas

The 1996 United States House of Representatives elections in Texas occurred on November 5, 1996, to elect the members of the state of Texas's delegation to the United States House of Representatives. Texas had thirty seats in the House, apportioned according to the 1990 United States census.

References

Citations

  1. "Congressional Districts Relationship Files (State-based) - Geography - U.S. Census Bureau". www.census.gov. Archived from the original on April 2, 2013. Retrieved October 6, 2023.
  2. 1 2 Center for New Media & Promotion (CNMP), US Census Bureau. "My Congressional District". www.census.gov.
  3. 1 2 "2022 Cook PVI: District Map and List". Cook Political Report. July 12, 2022. Retrieved January 10, 2023.
  4. "NationalJournal - Log In". www.nationaljournal.com.
  5. Wegman, Jesse; Winter, Damon (July 13, 2022). "Opinion | Gerrymander, U.S.A." The New York Times.
  6. Gilman, Todd J. (September 30, 2019). "Rep. Mac Thornberry becomes 6th Texas Republican in House to announce retirement ahead of 2020 election". Dallas Morning News . Retrieved September 30, 2019.
  7. 1 2 3 4 5 6 7 8 9 10 11 "Elections Division, Office of the Texas Secretary of State". elections.sos.state.tx.us. Archived from the original on May 12, 2000. Retrieved January 14, 2022.
  8. "Office of the Secretary of State, Race Summary Report, 2016 General Election". elections.sos.state.tx.us.
  9. "2018 General Election - RESULTS". enrpages.sos.state.tx.us. Archived from the original on November 11, 2018. Retrieved January 14, 2022.

General sources

34°50′16″N100°35′52″W / 34.83778°N 100.59778°W / 34.83778; -100.59778