Related Research Articles
Dundee City Council is the local government authority for the Dundee City council area. It was created in 1996 under the Local Government etc. (Scotland) Act 1994.
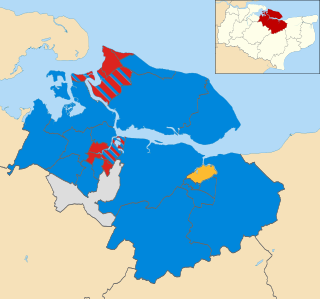
The 1999 Craven District Council election took place on 6 May 1999 to elect members of Craven District Council in North Yorkshire, England. One third of the council was up for election and the Conservative Party gained overall control of the council from no overall control.

The 2003 Craven District Council election took place on 1 May 2003 to elect members of Craven District Council in North Yorkshire, England. One third of the council was up for election and the council stayed under no overall control.
The 1913 Newmarket by-election was a parliamentary by-election held on 16 May 1913 to fill a vacancy in the United Kingdom House of Commons for the Eastern or Newmarket Division of Cambridgeshire.
Middlesex County Council under the Local Government Act 1888 had to be returned by local elections every three years. Its first election was in January 1889, the year the council first met. The last was in 1961 as the 1964 elections instead were – as to 83 of 87 divisions – for the larger, in-waiting Greater London Council – 4 divisions went into other counties, on abolition. Three intra-war elections were never announced and formally cancelled but otherwise expected in 1916, 1940 and 1943.
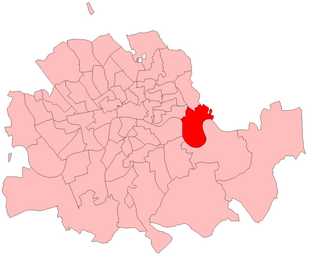
The 1914 Poplar by-election was a Parliamentary by-election held on 19 February 1914. The constituency returned one Member of Parliament (MP) to the House of Commons of the United Kingdom, elected by the first past the post voting system.
The 1913 Reading by-election was a Parliamentary by-election held on 8 November 1913. The constituency returned one Member of Parliament (MP) to the House of Commons of the United Kingdom, elected by the first past the post voting system.
The 1913 Chorley by-election was a Parliamentary by-election held on 19 February 1913. It returned one Member of Parliament (MP) to the House of Commons of the United Kingdom, elected by the first past the post voting system. Although it was a safe Unionist seat which was held, the reduction in the Unionist majority was notable.
The second election for the Cardiganshire County Council took place in March 1892. It was preceded by the inaugural 1889 election and followed by the 1895 election.
The 1910 Glamorgan County Council election was the eighth contest for seats on this local authority in south Wales. It was preceded by the 1907 election and followed by the 1913 election.

The 2003 Rother District Council election took place on 1 May 2003 to elect members of Rother District Council in East Sussex, England. The whole council was up for election after boundary changes reduced the number of seats by 7. The Conservative Party stayed in overall control of the council.
The ninth election for Cardiganshire County Council took place in March 1913. They were preceded by the 1910 election and followed by the 1919 election as no election took place in 1916 due to the First World War.

The 2012 Tandridge District Council election took place on 3 May 2012 to elect members of Tandridge District Council in Surrey, England. One third of the council was up for election and the Conservative Party stayed in overall control of the council.
The 2011 Swale Borough Council election took place on 5 May 2011 to elect members of Swale Borough Council in Kent, England. The whole council was up for election and the Conservative Party stayed in overall control of the council.
The ninth election to the Carmarthenshire County Council was held in March 1913. It was preceded by the 1910 election and followed, due to the First World War and the postponement of the 1916 elections, by the 1919 election.
The 1913 Glamorgan County Council election was the ninth contest for seats on this local authority in south Wales. It was preceded by the 1910 election and followed, due to the First World War, by the 1919 election.

The 2021 Cambridgeshire County Council election took place on 6 May 2021 as part of the 2021 local elections in the United Kingdom. All 61 councillors were elected from 59 electoral divisions, which returned either one or two county councillors each by first-past-the-post voting for a four-year term of office. The election was held alongside a full election for Cambridge City Council, the Cambridgeshire Police and Crime Commissioner, Mayor of Cambridgeshire and Peterborough and one-third of Peterborough City Council.
The 2022 North Yorkshire Council election took place on 5 May 2022, alongside the other local elections. These were the last elections to North Yorkshire County Council, and the elected councillors would also serve as the first councillors on the North Yorkshire Council, which replaced the existing county council in April 2023.

The 2022 Birmingham City Council election took place on 5 May 2022, with all 101 council seats up for election across 37 single-member and 32 two-member wards. The election was held alongside other local elections across Great Britain and town council elections in Sutton Coldfield.
The twelfth election to Cardiganshire County Council took place in March 1925. It was preceded by the 1922 election and followed by the 1928 election. While the previous election had been held in the shadow of bitter Liberal infighting at parliamentary level, the temperature had cooled and only ten seats were contested.
References
- ↑ "County Council Nominations". Carmarthen Journal. 7 March 1913. p. 6. Retrieved 3 May 2024.
| Pembrokeshire County Council | |
|---|---|
| Preseli Pembrokeshire District Council | |
| South Pembrokeshire District Council | |