2009 Air New Zealand Cup statistics

Last updated

2009 Air NZ Cup Statistics
Overall
Points Scored3953
43.4 per game
Tries Scored406
Team
Most Points ForHawke's Bay (372)
Fewest Points AgainstSouthland (189)
Most TriesCanterbury (40)
Hawke's Bay (40)
Wellington (40)
Player
Most PointsMatt Berquist (156)
Most TriesZac Guildford (13)

The 2009 Air New Zealand Cup ran from 30 July to 7 November. This page includes all statistics from the 14 teams during the 13 rounds of the round-robin.

Contents

There were 3953 points scored with an average of 43.4 points per game; there also were 406 tries scored.

Hawke's Bay scored the most points with 372 and, along with Canterbury and Wellington, the most tries with 40, while Southland had the best defensive record through the competition with only 189 points scored against them through 13 rounds.

Matt Berquist, from Hawke's Bay, scored the most points out of every player in the competition - with 156 points and an average of 14.2 points through his 11 matches. Zac Guildford scored the most tries this season with 13.

Overall

Team

The lists showing all statistics for all teams about points, tries and disciplinary cards.

Points

The table showing how many points scored by each team (white) and how many points each team was scored against them (grey) in the 2009 Air New Zealand Cup Round Robin. Hawke's Bay scored the most points so far with 372 (28.6 points a game), while Southland had the fewest points scored against them with 189 (14.5 points a game).

TeamPoints by RoundTotalAVG
12345678910111213
Auckland colours, Air NZ Cup.png Auckland 1347162232131516291422182320141681227131003714261827222320.917.2
Bopcolours.png Bay of Plenty 1914329211732161429191712192413172619227282827243026826720.620.5
CanterburyColours.png Canterbury 1922221646132521361417193616291731212817502627203936923128.417.8
CountiesAirNZ.png Counties Manukau 31369321551332183019623721614192817288541437192223543618.133.5
Hawkes Bay Air NZ Cup colours.png Hawke's Bay 4713132124249182826223034173210353022195482027321337228328.621.8
ManawatuTurbosColours.png Manawatu 363122302523191210121534202318253035154326502728421630536223.527.8
NorthHarbourRugby.png North Harbour 2219151992923262224131717341614281922332871337164224432018.824.6
NLTaniwha.png Northland 1419291613322623729151521372518213116217411927133222634117.426.2
Otagorugby.png Otago 19231926299121929718221636103226171038293521022192602832021.8
SouthlandRugby.png Southland 16626192325189242215151912146133213274102913932601892014.5
TaranakiRugby.png Taranaki 2191629242421331210171329161729141538100101329302425225119.419.3
TasmanMakosRugbyColours.png Tasman 9211915511521252628341523913241282116041021142224326018.720
Mooloo.png Waikato 616302213461632308302292323181514332235292719182628529721.922.8
Wellington Lions colours.png Wellington 23192113172116151436621916291823321343154173713221436223727.818.2
295289342286289318312259301324336312290395343.4
OverallForAgainst

Tries

The list of how many tries each team scored in the round robin. Canterbury, Wellington and Hawke's Bay scored the most tries this season with 40 each while Taranaki, North Harbour and Northland scored the fewest with 20 each.

TeamTotalTries by Round
12345678910111213
Auckland colours, Air NZ Cup.png Auckland 291142432113142
Bopcolours.png Bay of Plenty 241322110321134
CanterburyColours.png Canterbury 401153315433830
CountiesAirNZ.png Counties Manukau 305023135032123
Hawkes Bay Air NZ Cup colours.png Hawke's Bay 405120335441714
ManawatuTurbosColours.png Manawatu 354333122032435
NorthHarbourRugby.png North Harbour 201002113133311
NLTaniwha.png Northland 201212122321111
Otagorugby.png Otago 232142421121321
SouthlandRugby.png Southland 281232431111720
TaranakiRugby.png Taranaki 202122012114013
TasmanMakosRugbyColours.png Tasman 260262252122002
Mooloo.png Waikato 280411330204442
Wellington Lions colours.png Wellington 402212291047541
40626233628303931223135453129
Team and Round Total
Overall Total

Competition Points

List of how many competitions points each team scored with overall and week totals.

TeamTotalPoints by Round
12345678910111213
Auckland colours, Air NZ Cup.png Auckland 390151544114454
Bopcolours.png Bay of Plenty 324444041401042
CanterburyColours.png Canterbury 471454415544541
CountiesAirNZ.png Counties Manukau 122004005000001
Hawkes Bay Air NZ Cup colours.png Hawke's Bay 415020405554515
ManawatuTurbosColours.png Manawatu 245044101110115
NorthHarbourRugby.png North Harbour 204101110440400
NLTaniwha.png Northland 161404020401000
Otagorugby.png Otago 271151510040143
SouthlandRugby.png Southland 414414524400544
TaranakiRugby.png Taranaki 284020444015004
TasmanMakosRugbyColours.png Tasman 280451154044000
Mooloo.png Waikato 360500440445550
Wellington Lions colours.png Wellington 434414050155554
43335323432343333333333343334

Disciplinary cards

List of teams whose players received yellow and/or red cards. Bay of Plenty were issued the most cards with 5 while North Harbour were issued the only red card of the season.

TeamTotalCards by Round
Yellow card.svg Red card.svg 12345678910111213
Auckland colours, Air NZ Cup.png Auckland 200000001 Yellow card.svg 000001 Yellow card.svg
Bopcolours.png Bay of Plenty 501 Yellow card.svg 0000002 Yellow card.svg 1 Yellow card.svg 1 Yellow card.svg 000
CanterburyColours.png Canterbury 1001 Yellow card.svg 00000000000
CountiesAirNZ.png Counties Manukau 1000001 Yellow card.svg 00000000
Hawkes Bay Air NZ Cup colours.png Hawke's Bay 40001 Yellow card.svg 00001 Yellow card.svg 1 Yellow card.svg 0001 Yellow card.svg
ManawatuTurbosColours.png Manawatu 3000000001 Yellow card.svg 1 Yellow card.svg 01 Yellow card.svg 00
NorthHarbourRugby.png North Harbour 11000000001 Red card.svg 01 Yellow card.svg 00
NLTaniwha.png Northland 301 Yellow card.svg 00001 Yellow card.svg 0000001 Yellow card.svg
Otagorugby.png Otago 10000000000001 Yellow card.svg 0
SouthlandRugby.png Southland 100000001 Yellow card.svg 000000
TaranakiRugby.png Taranaki 3001 Yellow card.svg 1 Yellow card.svg 01 Yellow card.svg 00000000
TasmanMakosRugbyColours.png Tasman 2000000001 Yellow card.svg 0001 Yellow card.svg 0
Mooloo.png Waikato 30001 Yellow card.svg 00001 Yellow card.svg 001 Yellow card.svg 00
Wellington Lions colours.png Wellington 3001 Yellow card.svg 00001 Yellow card.svg 01 Yellow card.svg 0000
3312 Yellow card.svg 3 Yellow card.svg 3 Yellow card.svg 02 Yellow card.svg 1 Yellow card.svg 3 Yellow card.svg 6 Yellow card.svg 4 Yellow card.svg 1 Red card.svg 1 Yellow card.svg 3 Yellow card.svg 2 Yellow card.svg 3 Yellow card.svg
Team and Round Total
Overall Total

Player

The list of the top players who have scored the most points and tries in the 2009 Air New Zealand Cup. There were 3,953 points including 406 tries scored with a total of 218 players scoring them, Matt Berquist leads them all with 156 points and an average of 14.2 points per game. There have also been 33 yellow cards and 1 red card issued.

Top Ten Points Scorers

A total of 218 players from each team scored points in the round robin, Matt Berquist has scored the most with 156 and average of 14.2 points per game.

PlayerTeamTotalAVGPoints per RoundDetails
12345678910111213
Matt Berquist Hawkes Bay Air NZ Cup colours.png Hawke's Bay 15614.222814913DNPDNP12151719151234 pen; 2 dg; 24 con
Mike Delany Bopcolours.png Bay of Plenty 14912.414171122914129719213DNP1 try; 38 pen; 15 con
Lachlan Munro NLTaniwha.png Northland 14611.29248212516101111214134 try; 32 pen; 15 con
Callum Bruce Mooloo.png Waikato 1259.6610811181591312130081 try; 30 pen; 15 con
Willie Ripia TaranakiRugby.png Taranaki 11510.511DNPDNP995191291808151 try; 29 pen; 1 dg; 10 con
Robbie Robinson SouthlandRugby.png Southland 11110.1111686DNPDNP14988616929 pen; 12 con
Michael Harris NorthHarbourRugby.png North Harbour 10810.81715013DNPDNPDNP111371381128 pen; 12 con
Andrew Goodman TasmanMakosRugbyColours.png Tasman 1068.4331911169587110042 try; 19 pen; 1 dg; 18 con
Daniel Carter CanterburyColours.png Canterbury 9816.3142219DNP21DNPDNPDNPDNPDNP517DNP3 try; 21 pen; 10 con
Daniel Kirkpatrick Wellington Lions colours.png Wellington 958.66860018111812412DNPDNP1 try; 20 pen; 15 con

Top Try Scorers

A total of 218 players have scored a total of 406 tries. Zac Guildford has scored the most tries by a player this season with 13.

PlayerTeamTotalTries by Round
12345678910111213
Zac Guildford Hawkes Bay Air NZ Cup colours.png Hawke's Bay 13100011203131DNP
Hosea Gear Wellington Lions colours.png Wellington 11110114DNPDNPDNPDNP210
Sean Maitland CanterburyColours.png Canterbury 81001000222000
Ben Smith Otagorugby.png Otago 6001110002010DNP
Jared Payne NLTaniwha.png Northland 60011120100100
Jason Hona Bopcolours.png Bay of Plenty 50200000000012
Jason Shoemark Hawkes Bay Air NZ Cup colours.png Hawke's Bay 50010100200100
Sona Taumalolo Hawkes Bay Air NZ Cup colours.png Hawke's Bay 51100000010101
Sosene Anesi Mooloo.png Waikato 50100010100020
Many4Various

Top Goal Kickers

Mathew Berquist leads all goal kickers this season with 82.2% success rate. [1]

ConversionsPen. KicksDrop Goals
PlayerTeamAtt.Comp.Att.Comp.Att.Comp.Percentage
Matt Berquist Hawkes Bay Air NZ Cup colours.png Hawke's Bay 312438344282.2%
Daniel Kirkpatrick Wellington Lions colours.png Wellington 161529200077.8%
Daniel Carter CanterburyColours.png Canterbury 121028210077.5%
Glenn Dickson Otagorugby.png Otago 10623201076.5%
Piri Weepu Wellington Lions colours.png Wellington 00331075.0%
Mike Delany Bopcolours.png Bay of Plenty 201551380074.6%
Michael Harris NorthHarbourRugby.png North Harbour 151237283072.7%
Callum Bruce Mooloo.png Waikato 201541301072.6%
Isaac Thompson ManawatuTurbosColours.png Manawatu 141222140072.2%
Andrew Goodman TasmanMakosRugbyColours.png Tasman 231829192170.4%

Disciplinary Cards

The list of all players who have received a yellow or red card in the 2009 Air New Zealand Cup. Luke Braid and Colin Bourke, both from Bay of Plenty are the players who received the most disciplinary cards with two yellows each.

PlayerTeamTotalCards by Round
Yellow card.svg Red card.svg 12345678910111213
Colin Bourke Bopcolours.png Bay of Plenty 2000000001 Yellow card.svg 01 Yellow card.svg 000
Luke Braid Bopcolours.png Bay of Plenty 2000000001 Yellow card.svg 1 Yellow card.svg DNPDNP00
Adam Whitelock CanterburyColours.png Canterbury 1001 Yellow card.svg 000000DNPDNPDNPDNPDNP
Alex Ainley TasmanMakosRugbyColours.png Tasman 10DNP00000000001 Yellow card.svg 0
Andrew Mailei NorthHarbourRugby.png North Harbour 01000000001 Red card.svg DNPDNP00
Anthony Perenise Wellington Lions colours.png Wellington 10000DNP00DNP01 Yellow card.svg 0000
Ash Dixon Hawkes Bay Air NZ Cup colours.png Hawke's Bay 100000000000001 Yellow card.svg
Brent Thompson ManawatuTurbosColours.png Manawatu 10DNP0000DNP00001 Yellow card.svg 00
Bronson Murray NLTaniwha.png Northland 101 Yellow card.svg 0000000000DNPDNP
Craig Clarke TaranakiRugby.png Taranaki 1000001 Yellow card.svg 00000000
Daniel Ramsey Wellington Lions colours.png Wellington 100000001 Yellow card.svg 000000
Filo Paulo NorthHarbourRugby.png North Harbour 1000000000001 Yellow card.svg 00
Hamish Paterson Auckland colours, Air NZ Cup.png Auckland 1000DNP0001 Yellow card.svg 00DNPDNPDNP0
Hosea Gear Wellington Lions colours.png Wellington 1001 Yellow card.svg 0000DNPDNPDNPDNP000
James Goode ManawatuTurbosColours.png Manawatu 10000000001 Yellow card.svg 0000
Jamie Mackintosh SouthlandRugby.png Southland 100000001 Yellow card.svg DNP00000
Jarrad Hoeata TaranakiRugby.png Taranaki 10001 Yellow card.svg 0000000000
Joel McKenty NLTaniwha.png Northland 10000001 Yellow card.svg 00000DNPDNP
Johnny Leota ManawatuTurbosColours.png Manawatu 1000000001 Yellow card.svg 00000
Jordan Smiler Mooloo.png Waikato 10001 Yellow card.svg DNP0DNP0000000
Kahn Fotuali'i TasmanMakosRugbyColours.png Tasman 1000000001 Yellow card.svg 00DNPDNP0
Karl Haitana NLTaniwha.png Northland 100000000000001 Yellow card.svg
Liam Messam Mooloo.png Waikato 1000000000001 Yellow card.svg 0DNP
Mark Burman Bopcolours.png Bay of Plenty 101 Yellow card.svg 000000000000
Matt Egan Hawkes Bay Air NZ Cup colours.png Hawke's Bay 10000000001 Yellow card.svg 0000
Peter Mirrieless Otagorugby.png Otago 10000000000001 Yellow card.svg 0
Peter Saili Auckland colours, Air NZ Cup.png Auckland 100000000000001 Yellow card.svg
Ross Kennedy Hawkes Bay Air NZ Cup colours.png Hawke's Bay 1000000001 Yellow card.svg 00000
Save Tokula Mooloo.png Waikato 1000000001 Yellow card.svg 0DNPDNP00
Scott Waldrom TaranakiRugby.png Taranaki 10DNP1 Yellow card.svg 0DNP0000DNPDNPDNPDNPDNP
Sherwin Stowers CountiesAirNZ.png Counties Manukau 1000001 Yellow card.svg 00000000
Sona Taumalolo Hawkes Bay Air NZ Cup colours.png Hawke's Bay 10001 Yellow card.svg 0000000000

Individual Team Statistics

The lists showing each teams; points scorers, try scorers, goal kickers and disciplinary card recipients where available.

Auckland

Auckland scored 272 total points this season including 29 tries. Ash Moeke led them with 75 points scored through 13 games with an average of 5.8 points per game while Joe Rokocoko and Paul Williams led the try scorers with 4 tries each. Flanker Hamish Paterson and Peter Saili were the only players in the Auckland squad to receive a yellow card, which was in round 7 and round 13.

Points

PlayerTotalAVGPoints per RoundDetails
12345678910111213
Ash Moeke755.801112300033125101619 pen; 9 con
Daniel Bowden608.6130DNP7147136DNPDNPDNPDNPDNP3 try; 9 pen; 9 con
Joe Rokocoko 204DNPDNP10DNP10DNPDNPDNPDNPDNP0004 try
Paul Williams201.705DNP05005000504 try
Taniela Moa151.400DNP50000DNP100003 try
Jamie Helleur100.90DNPDNP00050000052 try
Onosai’i Auva’a100.90000DNP000DNP05502 try
Peter Saili100.400000000050502 try
Gareth Arlidge71.4DNPDNPDNPDNPDNPDNPDNPDNP000701 pen; 2 con
Atelia Pakalani50.5000DNPDNP050000001 try
Auvasa Faleali'i 50.6DNPDNP5DNP0DNP00000001 try
Benson Stanley50.400000500000DNP01 try
Charlie Faumuina51.30DNPDNP0DNPDNPDNPDNP0DNPDNPDNP51 try
Dave Thomas50.70050000DNPDNPDNPDNPDNPDNP1 try
Jerome Kaino51DNPDNP0DNP0DNPDNPDNPDNP005DNP1 try
Kurtis Haiu50.400000500000001 try
Pat Leafa51DNPDNPDNPDNPDNPDNPDNP0500001 try
Tevita Mailau50.500DNP0DNP500000001 try
27220.9131632152922231482710372629 try; 29 pen; 20 con

Tries

PlayerTotalPoints per Round
12345678910111213
Joe Rokocoko 4DNPDNP2DNP2DNPDNPDNPDNPDNP000
Daniel Bowden310DNP11000DNPDNPDNPDNPDNP
Paul Williams401DNP0100100010
Taniela Moa300DNP10000DNP2000
Jamie Helleur20DNPDNP0001000001
Onosa'i Auva'a20000DNP000DNP0110
Peter Saili20000000001010
Atelia Pakalani1000DNPDNP01000000
Auvasa Faleali'i1DNPDNP1DNP0DNP0000000
Benson Stanley100000100000DNP0
Charlie Faumuina10DNPDNP0DNPDNPDNPDNP0DNPDNPDNP1
Dave Thomas10010000DNPDNPDNPDNPDNPDNP
Jerome Kaino1DNPDNP0DNP0DNPDNPDNPDNP001DNP
Kurtis Haiu10000010000000
Pat Leafa1DNPDNPDNPDNPDNPDNPDNP010000
Tevita Mailau100DNP0DNP10000000
291142432113142

Goal Kicking

ConversionsPen. KicksDrop Goals
PlayerAtt.Comp.Att.Comp.Att.Comp.Percentage
Gareth Arlidge32110075.0%
Daniel Bowden1191492066.7%
Ash Moeke14926191068.3%
Gareth Arlidge1000000%
Paul Williams1000000%

Disciplinary Cards

PlayerTotalCards per Round
12345678910111213
Hamish Paterson100DNP000100DNPDNPDNP0
Peter Saili10000000000001
20000001000001

Bay of Plenty

Bay of Plenty scored a total of 268 points through 13 games with an average of 20.6 points per game. Mike Delany scored the most of these points with 149 and an average of 12.4 points a game. They also scored 24 tries, and were issued five disciplinary cards, also most throughout the competition.

Points

PlayerTotalAVGPoints per RoundDetails
12345678910111213
Mike Delany 14912.414171122914129719213DNP1 try; 38 pen; 15 con
Jason Hona251.90100000000005105 try
Luke Braid151.4500000005DNPDNP503 try
Phil Burliegh151.200000505000503 try
Cory Aporo100.9001000000000DNPDNP2 try
Culum Retallick100.800000000505002 try
Junior Poluleuligaga100.800050005000002 try
Nigel Hunt100.805005000000002 try
Colin Bourke90.700000005000041 try; 2 con
John Moore50.400000000000051 try
Solomon King50.7000500DNP0DNPDNPDNPDNPDNP1 try
Zar Lawrence50.4000000DNP0000051 try
26820.6193221261419122417197282424 try; 38 pen; 17 con

Tries

PlayerTotalTries per Round
12345678910111213
Jason Hona50200000000012
Luke Braid3100000001DNPDNP10
Phil Burleigh30000010100010
Cory Aporo200200000000DNPDNP
Culum Retallick20000000010100
Junior Poluleuligaga20001000000000
Nigel Hunt20100100000000
Colin Bourke10000000100000
John Moore10000000000001
Mike Delany1000000000100DNP
Solomon King1000100DNP0DNPDNPDNPDNPDNP
Zar Lawrence1000000DNP000001
241322110321134

Goal Kicking

ConversionsPen. KicksDrop Goals
PlayerAtt.Comp.Att.Comp.Att.Comp.Percentage
Mike Delany 201551380074.6%
Colin Bourke42101033.3%

Disciplinary Cards

PlayerTotalCards per Round
12345678910111213
Colin Boukre20000000101000
Luke Braid2000000011DNPDNP00
Mark Burman11000000000000
51000000211000

Canterbury

Canterbury scored 369 points through the round-robin. Daniel Carter scored the most of Canterbury's points, with 98 points and an average of 16.3 points a game. Canterbury also scored 40 tries this season with Sean Maitland scoring the most with 8. Adam Whitelock was the only player to receive a disciplinary card, with a yellow in round 2 against Auckland.

Points

PlayerTotalAVGPoints per RoundDetails
12345678910111213
Daniel Carter 9816.3142219DNP21DNPDNPDNPDNPDNP517DNP3 try; 21 pen; 10 con
Stephen Brett766.3000501216916510DNP32 try; 10 pen; 2 dg; 15 con
Sean Maitland403.150050001010100008 try
Colin Slade302.70071000DNPDNP085002 try; 4 pen; 4 con
James Paterson151.3000DNP0505000503 try
Tu Umaga-Marshall 151.9DNPDNPDNP5DNP005005DNP03 try
Tim Bateman151.250005050000003 try
Corey Flynn101.1DNPDNPDNP050000050DNP2 try
Sam Whitelock100.800000000505DNP02 try
Kieran Read105DNPDNP0DNPDNPDNPDNPDNPDNPDNP10DNPDNP2 try
Adam Whitelock50.600500000DNPDNPDNPDNPDNP1 try
Andy Ellis50.6DNPDNPDNP000000050DNP1 try
Ash Parker50.8DNPDNPDNPDNPDNP05000DNP0DNP1 try
Casey Laulala50.7DNPDNPDNPDNPDNPDNP50000001 try
George Whitelock50.50000500DNPDNP00001 try
Michael Paterson50.40000005000DNP001 try
Richie McCaw51.7DNPDNPDNPDNP0DNPDNPDNPDNPDNP05DNP1 try
Ti'i Paulo50.40000000005DNP001 try
Tyson Keats50.400500DNP00000001 try
Wyatt Crockett50.6005000DNPDNP0DNP00DNP1 try
36928.4192246253617362931285027340 try; 35 pen; 2 dg; 29 con

Tries

PlayerTotalTries per Round
12345678910111213
Sean Maitland81001000222000
Daniel Carter3010DNP0DNPDNPDNPDNPDNP11DNP
James Paterson3000DNP010100010
Tim Bateman30010101000000
Tu Umaga-Marshall3DNPDNPDNP1DNP001001DNP0
Stephen Brett200010010000DNP0
Kieran Read2DNPDNP0DNPDNPDNPDNPDNPDNPDNP2DNPDNP
Colin Slade2001000DNPDNP00100
Corey Flynn2DNPDNPDNP010000010DNP
Sam Whitelock200000000101DNP0
Andy Ellis1DNPDNPDNP000000010DNP
Adam Whitelock100100000DNPDNPDNPDNPDNP
Ash Parker1DNPDNPDNPDNPDNP01000DNP0DNP
Casey Laulala1DNPDNPDNPDNPDNPDNP1000000
George Whitelock10000100DNPDNP0000
Michael Paterson10000001000DNP00
Richie McCaw1DNPDNPDNPDNP0DNPDNPDNPDNPDNP01DNP
Ti'i Paulo10000000001000
Tyson Keats100100DNP0000000
Wyatt Crackett1001000DNPDNP0DNP00DNP
401153315433830

Goal Kicking

ConversionsPen. KicksDrop Goals
PlayerAtt.Comp.Att.Comp.Att.Comp.Percentage
Daniel Carter121028210077.5%
Colin Slade74640061.5%
Stephen Brett221519107256.3%
Andy Ellis0000100%

Disciplinary Cards

PlayerTotalCards per Round
12345678910111213
Adam Whitelock101000000DNPDNPDNPDNPDNP
10100000000000

Counties Manukau

Counties Manukau scored 235 total points this season with Tim Nanai-Williams leading them with 70 points, they also scored 30 tries, with Ahsee Tuala and Simon Lemalu leading them with 4 each. Winger Sherwin Stowers is the only player to receive a yellow card.

Points

PlayerTotalAVGPoints per RoundDetails
12345678910111213
Tim Nanai-Williams705.400218341260431442 try; 10 pen; 15 con
Josh Hall232.91193DNPDNP0DNPDNPDNP00001 try; 4 pen; 3 con
Ahsee Tuala201.75005050DNP500004 try
Simon Lemalu201.8500000100DNPDNP5004 try
Sherwin Stowers151.250050050000003 try
Fritz Lee101000500DNPDNP0500DNP2 try
Lelia Masaga101.350000DNP500DNPDNPDNPDNP2 try
Mark Selwyn1010050000DNP050DNPDNP2 try
Tasesa Lavea10100005DNP500DNPDNP002 try
Dean Cummins91.5DNPDNPDNPDNPDNP5004DNPDNP001 try; 2 con
Samisoni Fisilau81.1DNPDNP000DNPDNPDNP530DNP01 try; 1 dg
Alepeni Olosoni50.6DNPDNPDNPDNP0000000051 try
DJ Forbes50.40DNP000000000051 try
Ilaisa Maasi50.6DNPDNPDNPDNPDNP500000001 try
Siale Piutau50.60DNPDNPDNP0DNPDNP0500001 try
Sikeli Nabou515000DNP0DNPDNPDNPDNPDNPDNPDNP1 try
Waka Setitaia50.6DNP00DNPDNPDNPDNP0000051 try
23518319153381937619178141930 try; 13 pen; 1 dg; 20 con

Tries

PlayerTotalTries per Round
12345678910111213
Ahsee Tuala41001010DNP10000
Simon Lemalu410000020DNPDNP100
Sherwin Stowers30011001000000
Fritz Lee2000100DNPDNP0100DNP
Lelia Masaga210000DNP100DNPDNPDNPDNP
Mark Selwyn20010000DNP010DNPDNP
Tasesa Lavea200001DNP100DNPDNP00
Tim Nanai-Williams20000000000020
Alepeni Olosoni1DNPDNPDNPDNP000000001
Dean Cummins1DNPDNPDNPDNPDNP1000DNPDNP00
DJ Forbes10DNP00000000001
Ilaisa Maasi1DNPDNPDNPDNPDNP50000000
Josh Hall1100DNPDNP0DNPDNPDNP0000
Samisoni Fisilau1DNPDNP000DNPDNPDNP100DNP0
Siale Piutau10DNPDNPDNP0DNPDNP010000
Sikeli Nabou11000DNP0DNPDNPDNPDNPDNPDNPDNP
Waka Setitaia1DNP00DNPDNPDNPDNP000001
305023135032123

Goal Kicking

ConversionsPen. KicksDrop Goals
PlayerAtt.Comp.Att.Comp.Att.Comp.Percentage
Samisoni Fisilau000011100%
Tim Nanai-Williams211517100065.8%
Josh Hall631041041.2%
Dean Cummins32300033.3%
Tasesa Lavea0000100%

Disciplinary Cards

PlayerTotalCards per Round
12345678910111213
Sherwin Stowers10000100000000
10000100000000

Hawke's Bay

Hawke's Bay scored 372 points this season, most by any other team. Matt Berquist scored the most points with 156, most among players. They also scored 40 tries including the only penalty try of the season; Zac Guildford led them with 13 tries, also most among players. Sona Taumalolo, Ash Dixon, Matt Egan and Ross Kennedy were the only players in the Hawke's Bay team to receive disciplinary cards with yellows in round 3, round 8, round 9 and round 13.

Points

PlayerTotalAVGPoints per RoundDetails
12345678910111213
Mathew Berquist 15614.222814913DNPDNP12151719151234 pen; 2 dg; 24 con
Zac Guildford655.4500055100155155DNP13 try
Jason Shoemark251.9005050010005005 try
Sam Giddens21300DNPDNP0714DNPDNPDNPDNP001 try; 2 pen; 5 con
Sona Taumalolo251.955000000505055 try
Thomas Waldrom201.7500DNP00000010054 try
Jason Kupa151.550500DNP0000DNPDNP53 try
Israel Dagg100.8000000010000002 try
Karl Lowe100.850000000000052 try
Andrew Horrell50.4000005000000DNP1 try
Hugh Reed51.7DNPDNPDNPDNPDNP050DNPDNPDNPDNPDNP1 try
Mark Jackman50.6DNPDNP000500000DNPDNP1 try
Matt Egan50.400000050000001 try
Penalty Try5-00005000000001 try
37228.6471324928223432352254203240 try; 36 pen; 2 dg; 29 con

Tries

PlayerTotalTries per Round
12345678910111213
Zac Guildford13100011203131DNP
Jason Shoemark50010100200100
Sona Taumalolo51100000010101
Thomas Waldrom4100DNP000000201
Jason Kupa310100DNP0000DNPDNP1
Israel Dagg20000000200000
Karl Lowe21000000000001
Andrew Horrell1000001000000DNP
Hugh Reed1DNPDNPDNPDNPDNP010DNPDNPDNPDNPDNP
Mark Jackman1DNPDNP000100000DNPDNP
Matt Egan10000001000000
Sam Giddens100DNPDNP001DNPDNPDNPDNP00
Penalty Try10000100000000
405120335441714

Goal Kicking

ConversionsPen. KicksDrop Goals
PlayerAtt.Comp.Att.Comp.Att.Comp.Percentage
Mathew Berquist 312438344282.2%
Sam Giddens85220070.0%
Andrew Horrell1000000%
Jason Shoemark0000100%

Disciplinary Cards

PlayerTotalCards by Round
12345678910111213
Ash Dixon10000000000001
Matt Egan10000000010000
Ross Kennedy10000000100000
Sona Taumalolo10010000000000
40010000110001

Manawatu

Manawatu scored a total of 305 points in the 2009 Air New Zealand Cup. Isaac Thompson led them all with a tally of 71 points and an average of 5.9 a game. Manawatu have scored 35 tries this season, Andre Taylor led them with 3 tries. Johnny Leota, Brent Thompson and James Goode were the only players to receive disciplinary cards.

Points

PlayerTotalAVGPoints per RoundDetails
12345678910111213
Isaac Thompson715.5052000101815361201 try; 14 pen; 12 con
Aaron Cruden545.4161212455DNP0DNP00DNP02 try; 8 pen; 10 con
Andre Taylor373.100100000000DNP0274 try; 2 pen; 1 dg; 4 con
Tomasi Cama172.4DNPDNP0DNPDNPDNP0DNP570053 try; 1 con
Casey Stone151.5500100DNP00DNPDNP0003 try
Kurt Baker151.7000550005DNPDNPDNPDNP3 try
Tevita Taufui151.31000000DNP0005003 try
Brent Thompson100.9DNP0000DNP00500502 try
Frank Bryant103.350DNPDNPDNP5DNPDNPDNPDNPDNPDNPDNP2 try
James Goode100.800DNP000000010002 try
Johnny Leota100.800000050000052 try
Lote Raikubula100.805DNP00000050002 try
Reece Robinson101.1DNP00005DNPDNPDNP00502 try
Aaron James50.6DNPDNPDNP000DNP0005001 try
Aaron Smith50.400000050000001 try
Sean O'Connor50.4000000000005-1 try
30523.53622251910152018301526274235 try; 24 pen; 1 dg; 27 con

Tries

PlayerTotalTries per Round
12345678910111213
Andre Taylor40020000000DNP02
Casey Stone310020DNP00DNPDNP000
Kurt Baker3000110001DNPDNPDNPDNP
Tevita Taufui3200000DNP000100
Tomasi Cama3DNPDNP0DNPDNPDNP0DNP11001
Aaron Cruden2011000DNP0DNP00DNP0
Brent Thompson2DNP0000DNP0010010
Frank Bryant210DNPDNPDNP1DNPDNPDNPDNPDNPDNPDNP
James Goode20000000000200
Lote Raikabula201DNP0000001000
Reece Robinson2DNP00001DNPDNPDNPDNP010
Johnny Leota20000001000001
Aaron James10000000000100
Aaron Smith10000001000000
Issac Thompson10100000000000
Sean O'Connor10000000000010
Rob Foreman10000000000001
354333122032435

Goal Kicking

ConversionsPen. KicksDrop Goals
PlayerAtt.Comp.Att.Comp.Att.Comp.Percentage
Tomasi Cama110000100%
Isaac Thompson141222140072.2%
Andre Taylor54621158.3%
Aaron Cruden15111980052.9%

Disciplinary Cards

PlayerTotalCards by Round
12345678910111213
Brent Thompson1DNP0000DNP0000100
James Goode100DNP0000010000
Johnny Leota10000000100000
30000001100100

North Harbour

North Harbour scored a total of 244 points this season with an average of 19 points a game, they also scored 20 tries. Michael Harris scored the most points with 108 and an average of 10.8 points a game. North Harbour were issued two disciplinary cards including the only red card of the season, which went to Andrew Mailei in round 9.

Points

PlayerTotalAVGPoints per RoundDetails
12345678910111213
Michael Harris10810.81715013DNPDNPDNP111371381128 pen; 12 con
Ben Botica322.90DNPDNP022820000001 try; 7 pen; 3 con
Rudi Wulf151.4DNPDNP050000500053 try
Luke McAlister 144.7DNP09DNPDNPDNPDNPDNPDNPDNP5DNPDNP1 try; 3 pen
Anthony Tuitavake 101.75000DNPDNP5DNP0DNPDNPDNPDNP2 try
George Pisi100.900000050050DNP02 try
Nafi Tuitavake101.100000DNPDNPDNPDNP50502 try
Nalu Tuigamala101.4DNPDNP00DNPDNPDNP0DNP010002 try
Andrew Mailei50.5000000050DNPDNP001 try
Chris Smylie50.5000005000DNPDNP001 try
Fili Paulo50.400050000000001 try
Josh York51.7DNPDNPDNPDNPDNP050DNPDNPDNPDNPDNP1 try
Ken Pisi50.50DNP0DNP0000050001 try
Scott Uren50.7DNPDNPDNPDNPDNPDNP00500001 try
Tom Chamberlain50.6DNPDNPDNPDNP0000500DNP01 try
24419221592322131716282228131620 try; 38 pen; 15 con

Tries

PlayerTotalTries per Round
12345678910111213
Rudi Wulf3DNPDNP01000010001
Anthony Tuitavake 21000DNPDNP1DNP0DNPDNPDNPDNP
George Pisi200000010010DNP0
Nafi Tuitavake200000DNPDNPDNPDNP1010
Nalu Tuigamala2DNPDNP00DNPDNPDNP0DNP0200
Andrew Mailei1000000010DNPDNP00
Ben Botica10DNPDNP0100000000
Chris Smylie1000001000DNPDNP00
Fili Paulo10001000000000
Josh York1DNPDNPDNPDNPDNP010DNPDNPDNPDNPDNP
Ken Pisi10DNP0DNP000001000
Luke McAlister1DNPDNP0DNPDNPDNPDNPDNPDNPDNP1DNPDNP
Scott Uren1DNPDNPDNPDNPDNPDNP0010000
Tom Chamberlain1DNPDNPDNPDNP0000100DNP0
201002113133311

Goal Kicking

ConversionsPen. KicksDrop Goals
PlayerAtt.Comp.Att.Comp.Att.Comp.Percentage
Michael Harris151237283072.7%
Ben Botica53972062.5%
Luke McAlister 00630050.0%

Disciplinary Cards

PlayerTotalCards by Round
Yellow card.svg Red card.svg 12345678910111213
Andrew Mailei01000000001 Red card.svg DNPDNP00
Filo Paulo1000000000001 Yellow card.svg 00
11000000001 Red card.svg 01 Yellow card.svg 00

Northland

Northland scored 226 points this season with an average of 17.8 points per game, Lachlan Munro led the team with a tally of 146 points throughout his 13 games. They have also scored 20 tries, which captain Jared Payne led with 6, and had one player receive a disciplinary card, which was also the first in the competition.

Points

PlayerTotalAVGPoints per RoundDetails
12345678910111213
Lachlan Munro 14611.29248212516101111214134 try; 32 pen; 15 con
Jared Payne302.3005051005005006 try
Joel McKenty151.4000000051000DNPDNP3 try
Brook Gilmore50.8000500DNPDNPDNPDNPDNPDNPDNP1 try
Damien Fakafanua50.5DNP000000000DNP501 try
Derek Carpenter50.405000000000001 try
Mikaele Tuu'u50.400000050000001 try
Rene Ranger50.500000005000DNPDNP1 try
Roy Griffin50.6DNPDNPDNPDNPDNP000050001 try
Troy Woodman51500DNPDNPDNPDNPDNPDNPDNP00DNP1 try
22617.414291326715212521167191320 try; 32 pen; 15 con

Tries

PlayerTotalTries per Round
12345678910111213
Jared Payne60010120100100
Lachlan Munro 40101001000001
Joel McKenty300000001200DNPDNP
Brook Gilmore1000100DNPDNPDNPDNPDNPDNPDNP
Damien Fakafanua1DNP000000000DNP50
Derek Carpenter10100000000000
Mikaele Tuu'u10000001000000
Rene Ranger100000001000DNPDNP
Roy Griffin1DNPDNPDNPDNPDNP00001000
Troy Woodman1100DNPDNPDNPDNPDNPDNPDNP00DNP
201212122321111

Goal Kicking

ConversionsPen. KicksDrop Goals
PlayerAtt.Comp.Att.Comp.Att.Comp.Percentage
Lachlan Munro 191547323068.1%
David Holwell0000100%

Disciplinary Cards

PlayerTotalCards by Round
12345678910111213
Bronson Murray110000000000DNPDNP
Joel McKenty100000100000DNPDNP
21000010000000

Otago

Otago scored 260 points this season with Glenn Dickson leading them all with 72 points and an average of 5.5 points a game. Ben Smith led the team with 6 tries from a total of 26 from the team. Peter Mirrielees was the only player to receive a disciplinary card with a yellow in round 12.

Points

PlayerTotalAVGPoints per RoundDetails
12345678910111213
Glenn Dickson725.5000005921651491220 pen; 6 con
Chris Noakes531114141429DNPDNPDNPDNPDNPDNPDNPDNP2 try; 9 pen; 8 con
Ben Smith302.50055500010050DNP6 try
Adam Thomson 202.25000100DNPDNPDNP050DNP4 try
Karne Hesketh201.500550500005004 try
Michael Witt151.9DNPDNPDNPDNP032300DNP253 pen; 3 con
Ryan Shortland151.7DNP50DNP5500000DNP03 try
Aaron Bancroft50.8DNPDNPDNP0000DNPDNPDNPDNP501 try
Alando Soakai50.400000000000051 try
Ben Nolan50.500000DNPDNP0000501 try
Keith Cameron51.3DNPDNPDNPDNPDNP0500DNPDNPDNPDNP1 try
Paul Grant50.400000005000001 try
Sean Romans50.400000000050001 try
Tom Donnelly50.5005000DNPDNP0000DNP1 try
260201919291229181610261029212226 try; 30 pen; 17 con

Tries

PlayerTotalTries per Round
12345678910111213
Ben Smith6001110002010DNP
Adam Thomson 4100020DNPDNPDNP010DNP
Karne Hesketh40011010000100
Ryan Shortland3DNP10DNP1100000DNP0
Chris Noakes210100DNPDNPDNPDNPDNPDNPDNPDNP
Aaron Bancroft1DNPDNPDNP0000DNPDNPDNPDNP10
Alando Soakai10000000000001
Ben Nolan100000DNPDNP000010
Keith Cameron1DNPDNPDNPDNPDNP0100DNPDNPDNPDNP
Paul Grant10000000100000
Sean Romans10000000001000
Tom Donnelly1001000DNPDNP0000DNP
262142431121321

Goal Kicking

ConversionsPen. KicksDrop Goals
PlayerAtt.Comp.Att.Comp.Att.Comp.Percentage
Michael Witt33331085.7%
Glenn Dickson10623201076.5%
Chris Noakes1381491060.7%

Disciplinary Cards

PlayerTotalCards per Round
12345678910111213
Peter Mirrielees10000000000010
10000000000010

Southland

Southland scored 260 points throughout round-robin with an average of 20 points per game. Robbie Robinson scored the most with a tally of 111 points through his 11 games. They also scored 28 tries with locks Josh Bekhuis and Joe Tuineau leading the team with 4 each. Jamie Mackintosh was the only Southland player to receive a yellow card which came in round 7.

Points

PlayerTotalAVGPoints per RoundDetails
12345678910111213
Robbie Robinson11110.1111686DNPDNP14988616929 pen; 12 con
Joe Tuineau201.500005050500504 try
Josh Bekhuis201.505055500000004 try
Kendrick Lynn191.505504000000503 try; 2 con
Glen Horton151.9DNPDNPDNPDNPDNP0000015003 try
Jason Rutledge151.200005500005003 try
John Hardie151.200500000055003 try
Pehi Te Whare100.9500000DNP50000DNP1 try
David Hall50.40005DNP000000001 try
Fai Mika50.4000005DNP0000001 try
Jamie Mackinstosh50.40050000DNP000001 try
Jason Kawau50.400000000005001 try
Jimmy Cowan51.3DNPDNP0DNPDNP0DNPDNPDNPDNP50DNP1 try
Matt Saunders50.4000DNP5000000001 try
John Dodds31.5DNPDNPDNPDNPDNP0DNPDNPDNPDNPDNP3DNP3 pen
James Wilson20.2DNPDNP020DNP00000001 con
26020162623182415231413134129928 try; 30 pen; 15 con

Tries

PlayerTotalTries per Round
12345678910111213
Joe Tuineau40000101010010
Josh Bekhuis40101110000000
Glen Horton3DNPDNPDNPDNPDNP00000300
Jason Rutledge30000110000100
John Hardie30010000001100
Kendrick Lynn30110000000010
Pehi Te Whare2100000DNP10000DNP
David Hall10001DNP00000000
Fai Mika1000001DNP000000
Jamie Mackintosh10010000DNP00000
Jason Kawau10000000000100
Jimmy Cowan1DNPDNP0DNPDNP0DNPDNPDNPDNP10DNP
Matt Saunders1000DNP100000000
281232431111720

Goal Kicking

ConversionsPen. KicksDrop Goals
PlayerAtt.Comp.Att.Comp.Att.Comp.Percentage
John Dodds001100100%
Robbie Robinson171238295068.3%
Kendrick Lynn42200033.3%
James Wilson41201014.3%
Seminar Manu2000100%

Disciplinary Cards

PlayerTotalCards per Round
12345678910111213
Jamie Mackintosh10000001DNP00000
10000001000000

Taranaki

Taranaki scored 252 points this season, with Willie Ripia scoring the most with 115 points through his 11 games. They also scored 20 tries with Tony Penn and Shayne Austin leading them with 3 each. Three Taranaki players received disciplinary cards, all yellow; Scott Waldrom in round 2 against Northland, Jarrad Hoeata in there round 3 draw against Hawke's Bay and Craig Clarke in Round 5 against Manawatu.

Points

PlayerTotalAVGPoints per RoundDetails
12345678910111213
Willie Ripia11510.511DNPDNP995191291808151 try; 29 pen; 1 dg; 10 con
Jack Cameron494.1011192012500000DNP2 try; 11 pen; 3 con
Shayne Austin151.250000005000503 try
Tony Penn151.2000000005100003 try
Jayden Hayward100.855000000000002 try
Paul Perez101.3DNPDNPDNPDNPDNP000050052 try
Ben Souness50.50DNPDNP00000000051 try
Jason Eaton50.8DNPDNP5DNP00DNPDNPDNP000DNP1 try
John Willis50.400000DNP50000001 try
Leon Power50.600DNPDNPDNP00000DNP051 try
Nathan Hohaia50.400050000000001 try
Nemia Soqeta50.60DNPDNP00DNP00DNP50DNP01 try
Samuela Vinusa50.8DNP005DNPDNPDNPDNP0DNPDNP001 try
Brett Goodin 30.200003000000001 dg
25219211624211217291714380133020 try; 40 pen; 2 dg; 13 con

Tries

PlayerTotalTries per Round
12345678910111213
Shayne Austin31000000100010
Tony Penn30000000012000
Jack Cameron2001000100000DNP
Jayden Hayward21100000000000
Paul Perez2DNPDNPDNPDNPDNP00001001
Ben Souness10DNPDNP0000000001
Nathan Hohaia10001000000000
Jason Eaton1DNPDNP1DNP00DNPDNPDNP000DNP
John Willis100000DNP1000000
Leon Power100DNPDNPDNP00000DNP01
Nemia Soqeta10DNPDNP00DNP00DNP10DNP0
Samuela Vinusa1DNP001DNPDNPDNPDNP0DNPDNP00
Willie Ripia10DNPDNP0010000000
202122012114013

Goal Kicking

ConversionsPen. KicksDrop Goals
PlayerAtt.Comp.Att.Comp.Att.Comp.Percentage
Brett Goodin 000011100%
Willie Ripia151039294169.0%
Jack Cameron5316111063.6%
Shayne Austin0000100%

Disciplinary Cards

PlayerTotalCards by Round
12345678910111213
Craig Clarke10000100000000
Jarrad Hoeata10010000000000
Scott Waldrom1DNP10DNP0000DNPDNPDNPDNPDNP
30110100000000

Tasman

Tasman scored a total of 243 points this season. They have also scored 26 tries. Captain Andrew Goodman scored most points scoring 106 points through 13 games while wingers James Kamana and Blair cook led the team with 4 tries each. Kahn Fotuali'i and Alex Ainley were the only players from the team have been given yellow cards.

Points

PlayerTotalAVGPoints per RoundDetails
12345678910111213
Andrew Goodman1068.23319111391587110042 try; 19 pen; 1 dg; 18 con
Blair Cook201.5001000500500004 try
James Kamana201.7001055000000DNP04 try
Afeleke Pelenise151.200000550050003 try
Kahn Fotuali'i131.20005053000DNPDNP02 try; 1 dg
Alex Ainley100.8DNP0000505000002 try
Matty James80.906200000DNPDNP0DNPDNP2 pen; 1 con
James Marshall113.76DNPDNPDNPDNPDNPDNPDNPDNPDNPDNP051 try; 2 pen
Daniel Perrin50.400000000000051 try
Glen Gregory50.6DNPDNPDNPDNP0500000001 try
Mark Bright50.400005000000001 try
Robbie Malneek50.405000000000001 try
Tristan Moran50.405000000000001 try
Sione Halani50.7DNPDNP5000DNPDNP00DNP0DNP1 try
Kade Poki50.400500DNP00000001 try
Quentin MacDonald50.400000000050001 try
24318.79195121263423131221001426 try; 23 pen; 2 dg; 19 con

Tries

PlayerTotalTries per Round
12345678910111213
Blair Cook40020010010000
James Kamana400211000000DNP0
Afeleke Pelenise30000011001000
Alex Ainley2DNP000010100000
Andrew Goodman20000001010000
Kahn Fotuali'i20001010000DNPDNP0
Daniel Perrin10000000000001
Glen Gregory1DNPDNPDNPDNP010000000
James Marshall10DNPDNPDNPDNPDNPDNPDNPDNPDNPDNP01
Mark Bright10000100000000
Robbie Malneek10100000000000
Tristan Moran10100000000000
Sione Halani1DNPDNP1000DNPDNP00DNP0DNP
Kade Poki100100DNP0000000
Quentin MacDonald10000000001000
260262252122002

Goal Kicking

ConversionsPen. KicksDrop Goals
PlayerAtt.Comp.Att.Comp.Att.Comp.Percentage
Kahn Fotuali'i000011100%
Andrew Goodman231829192170.4%
Matty James21321050.0%
James Marshall00420050.0%

Disciplinary Cards

PlayerTotalCards per Round
12345678910111213
Kahn Fotuali'i10000000100DNPDNP0
Alex Ainley1DNP000000000010
10000000100010

Waikato

Waikato scored 285 points this season which Callum Brucescoring the most with 125 points through 13 games with an average of 9.6 points per game. They also scored 28 tries, led by Sosene Anesi with 5. Jordan Smiler, Liam Messam and Save Tokula were the only players to receive a disciplinary card for Waikato; all yellow.

Points

PlayerTotalAVGPoints per RoundDetails
12345678910111213
Callum Bruce 1259.6610811201591312130081 try; 30 pen; 15 con
Stephen Donald276.8DNPDNPDNPDNP5DNPDNPDNPDNP0157DNP1 try; 4 pen; 5 con
Sosene Anesi251.9005005050001005 try
Dwayne Sweeney151.200005000050503 try
Henry Speight101.3DNPDNPDNP0050005DNPDNP02 try
Jackson Willison102DNPDNPDNPDNPDNPDNPDNPDNP0010002 try
Liam Messam 100.8050000000500DNP2 try
Save Tokula100.9000505000DNPDNP002 try
Tim Mikkelson100.800000000055002 try
Trent Renata80.70000DNP0003DNP0051 try; 1 dg
Aled de Malmanche50.6DNP00DNP00DNPDNPDNP00501 try
Hikairo Forbes50.4DNP0000000005001 try
Jack Lam50.40000DNP000000051 try
Latu Talakai50.6DNPDNPDNP0DNPDNP05000001 try
Romana Graham50.400500000000001 try
Sam Christie5100500DNPDNPDNPDNPDNPDNPDNPDNP1 try
Sione Lauaki55DNPDNP5DNPDNPDNPDNPDNPDNPDNPDNPDNPDNP1 try
28521.963013163030923153335271828 try; 30 pen; 1 dg; 17 con

Tries

PlayerTotalPoints per Round
12345678910111213
Sosene Anesi50100010100020
Dwayne Sweeney30000100001010
Henry Speight2DNPDNPDNP0010001DNPDNP0
Jackson Willison2DNPDNPDNPDNPDNPDNPDNPDNP00200
Liam Messam 2010000000100DNP
Save Tokula2000101000DNPDNP00
Tim Mikkelson20000000001100
Aled de Malmanche1DNP00DNP00DNPDNPDNP0010
Callum Bruce10000100000000
Hikairo Forbes1DNP000000000100
Jack Lam10000DNP00000001
Latu Talakai1DNPDNPDNP0DNPDNP0100000
Romana Graham10010000000000
Sam Christie101000DNPDNPDNPDNPDNPDNPDNPDNP
Sione Lauaki1DNP1DNPDNPDNPDNPDNPDNPDNPDNPDNPDNPDNP
Stephen Donald1DNPDNPDNPDNP1DNPDNPDNPDNP000DNP
Trent Renata10000DNP0000DNP001
280411330204442

Goal Kicking

ConversionsPen. KicksDrop Goals
PlayerAtt.Comp.Att.Comp.Att.Comp.Percentage
Stephen Donald85541064.3%
Callum Bruce 201541301072.6%
Trent Renata00002150.0%
Dwayne Sweeney0000100%
Sam Christie0000100%

Disciplinary Cards

PlayerTotalCards per Round
12345678910111213
Jordan Smiler1001DNP0DNP0000000
Liam Messam1000000000010DNP
Save Tokula1000000010DNPDNP00
30010000100100

Wellington

Wellington scored 362 points through the round-robin with an average of 28.3 points per game, and also scored 39 tries. Daniel Kirkpatrick led the team in points with 95 through his 11 games while Hosea Gear led the team in tries with 11. Hosea Gear also, along with Daniel Ramsey and Anthony Perenise, received a disciplinary card, all yellow.

Points

PlayerTotalAVGPoints per RoundDetails
12345678910111213
Daniel Kirkpatrick958.66860018111812412DNPDNP1 try; 20 pen; 15 con
Fa'atonu Fili685.2736644005441781 try; 8 pen; 3 dg; 15 con
Hosea Gear 556.15505520DNPDNPDNPDNP105011 try
Daniel Ramsey201.550000000550054 try
Alby Mathewson151.2000000000105003 try
David Smith151.405000DNP0055DNP003 try
Robert Fruean151.400000550050DNPDNP3 try
Alapati Leiua1010DNPDNP0DNP000050502 try
Cory Jane101.7DNPDNPDNPDNP05DNPDNP0500DNP2 try
Ma'a Nonu105DNPDNPDNPDNP5DNPDNPDNPDNPDNPDNP5DNP2 try
Scott Fuglistaller100.90050DNP5000000DNP2 try
Piri Weepu94.5DNPDNPDNPDNPDNPDNPDNPDNPDNPDNPDNP093 pen
Apoua Stewart 51DNPDNPDNPDNPDNPDNP0050DNPDNP01 try
Ged Robinson50.400000000005001 try
Jacob Ellison50.400000000000501 try
John Schwalger50.400050DNP00000001 try
Mathew Luamanu50.500000500DNP0DNPDNP01 try
Tamati Ellison51.3DNP00DNPDNPDNPDNPDNPDNPDNP50DNP1 try
36227.82321171614621618324341372240 try; 31 pen; 3 dg; 30 con

Tries

PlayerTotalTries per Round
12345678910111213
Hosea Gear 11110114DNPDNPDNPDNP210
Daniel Ramsey41000000011001
Alby Mathewson30000000002100
David Smith301000DNP0011DNP00
Robert Fruean300000110010DNPDNP
Alapati Leiua20DNPDNP0DNP00001010
Cory Jane2DNPDNPDNPDNP01DNPDNP0100DNP
Ma'a Nonu2DNPDNPDNPDNP1DNPDNPDNPDNPDNPDNP1DNP
Scott Fuglistaller20010DNP1000000DNP
Apoua Stewart1DNPDNPDNPDNPDNPDNP0010DNPDNP0
Daniel Kirkpatrick100000100000DNPDNP
Fa'atonu Fili10000000010000
Ged Robinson10000000000100
Jacob Ellison10000000000010
John Schwalger100010DNP000000DNP
Mathew Luamanu100000100DNP0DNPDNP0
Tamati Ellison1DNP00DNPDNPDNPDNPDNPDNPDNP10DNP
402212291017541

Goal Kicking

ConversionsPen. KicksDrop Goals
PlayerAtt.Comp.Att.Comp.Att.Comp.Percentage
Daniel Kirkpatrick161529200077.8%
Piri Weepu00331075.0%
Fa'atonu Fili211514810357.8%
Cory Jane0000100%

Disciplinary Cards

PlayerTotalCards per Round
12345678910111213
Anthony Perenise1000DNP00DNP010000
Daniel Ramsey10000001000000
Hosea Gear 1010000DNPDNPDNPDNP000
30100001010000

Related Research Articles

<span class="mw-page-title-main">500 (card game)</span> Trick-taking card game

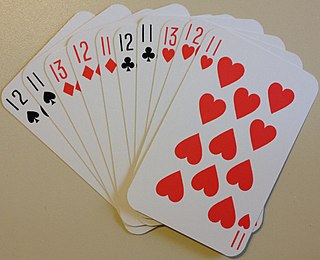
500 or Five Hundred is a trick-taking game developed in the United States from Euchre. Euchre was extended to a 10 card game with bidding and a Misère contract similar to Russian Preference, producing a cutthroat three-player game like Preference and a four-player game played in partnerships like Whist which is the most popular modern form, although with special packs it can be played by up to six players.

<span class="mw-page-title-main">Spades (card game)</span> Card game

Spades is a trick-taking card game devised in the United States in the 1930s. It can be played as either a partnership or solo/"cutthroat" game. The object is to take the number of tricks that were bid before play of the hand began. Spades is a descendant of the whist family of card games, which also includes bridge, hearts, and oh hell. Its major difference as compared to other whist variants is that, instead of trump being decided by the highest bidder or at random, the spade suit always trumps, hence the name.

Pitch is the American name of the English trick-taking game of Blind All Fours which, in turn, is derived from classic All Fours. Historically, Pitch started as "Blind All Fours", a very simple All Fours variant that is still played in England as a pub game. The modern game involving a bidding phase and setting back a party's score if the bid is not reached came up in the middle of the 19th century and is more precisely known as Auction Pitch or Setback.

<span class="mw-page-title-main">Jass</span> Card game

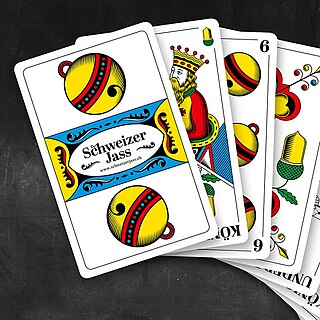
Jass is a family of trick taking, ace–ten card games and, in its key forms, a distinctive branch of the marriage family. It is popular in its native Switzerland as well as the rest of the Alemannic German-speaking area of Europe, Italian South Tyrol and in a few places in Wisconsin, Ohio, California, Oregon and Washington USA.

<span class="mw-page-title-main">Fouls and misconduct (association football)</span> Unfair act by a player in association football

In the sport of association football, fouls and misconduct are acts committed by players which are deemed by the referee to be unfair and are subsequently penalised. An offence may be a foul, misconduct or both depending on the nature of the offence and the circumstances in which it occurs. Fouls and misconduct are addressed in Law 12 of the Laws of the Game. A foul is an unfair act by a player, deemed by the referee to contravene the game's laws, that interferes with the active play of the match. Fouls are punished by the award of a free kick to the opposing team. A list of specific offences that can be fouls are detailed in Law 12 of the Laws of the Game ; these mostly concern unnecessarily aggressive physical play and the offence of handling the ball. An infringement is classified as a foul when it meets all the following conditions:

  1. It is committed by a player ;
  2. It occurs on the field of play;
  3. It occurs while the ball is in play;
  4. It is committed against an opponent.

400 is a trick-taking card game played in two partnerships with a standard deck of 52 playing cards. The object of the game is to be the first team to reach forty-one points. The game somewhat resembles Spades, but with subtle differences. It was in the early years after the Ottoman Empire. Historically, the game is mainly played in Syria, Lebanon, Palestine, Jordan, Honduras, and The Philippines. It is similar to the game Tarneeb, which is also played in the region.

304, pronounced three-nought-four, is a trick-taking card game popular in Sri Lanka, coastal Karnataka, Tamil Nadu and Maharashtra, in the Indian subcontinent. The game is played by two teams of two using a subset of the 52 standard playing cards so that there are 32 cards in play.

Joshua Michael Pace is an American former professional basketball player who spent the majority of his ten-year career playing in the New Zealand National Basketball League. He also had successful stints playing college basketball for Syracuse and playing in the ABA for the Mavericks. He currently serves as the head coach for the Western New Mexico Mustangs women's basketball team.

These are the statistics for the Euro 2008 in Austria and Switzerland.

The 2009 Air New Zealand Cup was the 33rd provincial rugby union competition, the fourth since the competition reconstruction in 2006, involving the top 14 provincial unions in New Zealand. It ran for 15 weeks from 30 July to 7 November. It was also the last edition of the provincial competition to use the Air New Zealand Cup name, as the competition's sponsorship contract with Air New Zealand ended after that season. The 2010 competition will be held under a new name, the ITM Cup.

The 2009 Air New Zealand Cup will be the Wellington Rugby Football Union's 4th consecutive participation in the competition. They are coming off a 2008 placing of 2nd. Last year Wellington lost the final 7–6 at Westpac Stadium. This was after Wellington had won their first nine games including beating Auckland for the Ranfurly Shield. Wellington then lost their final round game to Otago. Despite wins in the quarter and semi finals, Canterbury were too strong in the Grand Final. This was Wellington's 5th loss in a final in 6 years.

The 2009 Air New Zealand Cup Finals will determine the winner of the 2009 Air New Zealand Cup season. It will consist of two semifinals on 30 and 31 October and Grand Final on 7 November.

Family Game Night is an American television game show based on Hasbro's family of board games and EA's video game franchise of the same name. The show was hosted by Todd Newton. Burton Richardson was the announcer for the first two seasons; he was replaced by Stacey J. Aswad in the third season, and Andrew Kishino was hired for the fourth season. The 60-minute program debuted on October 10, 2010, on The Hub ; it was previewed on October 9, 2010, on its sister channel, TLC. Seasons 1 and 2 contained 26 and 30 episodes respectively. Seasons 3, 4 and 5 each contained 15 episodes. Season 2 premiered on Friday, September 2, 2011, with additional games being added. The games added to the second season included Cranium Brain Breaks, Green Scream, Ratuki Go-Round, Simon Flash, Operation Sam Dunk, Trouble Pop Quiz, and Spelling Bee. However games from the previous season were still kept.

Statistics of Dhivehi League in the 2012 season. According to the FAM Calendar 2012, Dhiraagu Dhivehi League will start on April 18 and is set to end on September 27. The winner will qualify for the AFC Cup and 2nd place will qualify for AFC Cup play-offs.

These are the statistics for the UEFA Euro 2012, which took place in Poland and Ukraine.

These are the statistics for the Euro 2004 in Portugal.

These are the statistics for UEFA Euro 2000, held in Belgium and Netherlands.

These are the statistics for the Euro 1992 in Sweden.

The Genius: Rules of the Game is the first season of The Genius debuted on tvN on April 26, 2013.

The Genius: Rule Breaker is the second season of The Genius, which debuted on tvN on December 7, 2013.

References

  1. Minimum average of 3 attempts per game (1 game = 1 attempt)