Related Research Articles

Color, or colour, is the characteristic of visual perception described through color categories, with names such as red, orange, yellow, green, blue, or purple. This perception of color derives from the stimulation of photoreceptor cells by electromagnetic radiation. Color categories and physical specifications of color are associated with objects through the wavelengths of the light that is reflected from them and their intensities. This reflection is governed by the object's physical properties such as light absorption, emission spectra, etc.

Rendering or image synthesis is the process of generating a photorealistic or non-photorealistic image from a 2D or 3D model by means of a computer program. The resulting image is referred to as the render. Multiple models can be defined in a scene file containing objects in a strictly defined language or data structure. The scene file contains geometry, viewpoint, texture, lighting, and shading information describing the virtual scene. The data contained in the scene file is then passed to a rendering program to be processed and output to a digital image or raster graphics image file. The term "rendering" is analogous to the concept of an artist's impression of a scene. The term "rendering" is also used to describe the process of calculating effects in a video editing program to produce the final video output.
In colorimetry, metamerism is a perceived matching of colors with different (nonmatching) spectral power distributions. Colors that match this way are called metamers.
In digital signal processing, spatial anti-aliasing is a technique for minimizing the distortion artifacts known as aliasing when representing a high-resolution image at a lower resolution. Anti-aliasing is used in digital photography, computer graphics, digital audio, and many other applications.
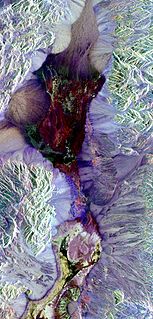
Remote sensing is the acquisition of information about an object or phenomenon without making physical contact with the object and thus in contrast to on-site observation, especially the Earth. Remote sensing is used in numerous fields, including geography, land surveying and most Earth science disciplines ; it also has military, intelligence, commercial, economic, planning, and humanitarian applications.

A luminosity function or luminous efficiency function describes the average spectral sensitivity of human visual perception of brightness. It is based on subjective judgements of which of a pair of different-colored lights is brighter, to describe relative sensitivity to light of different wavelengths. It should not be considered perfectly accurate, but it is a good representation of visual sensitivity of the human eye and it is valuable as a baseline for experimental purposes. Different luminosity functions apply under different lighting condition, varying from photopic in brightly lit conditions through mesotopic to scotopic under low lighting conditions. Without qualification, the luminosity function generally refers to the photopic luminosity function.
Colorimetry is "the science and technology used to quantify and describe physically the human color perception." It is similar to spectrophotometry, but is distinguished by its interest in reducing spectra to the physical correlates of color perception, most often the CIE 1931 XYZ color space tristimulus values and related quantities.

A time series is a series of data points indexed in time order. Most commonly, a time series is a sequence taken at successive equally spaced points in time. Thus it is a sequence of discrete-time data. Examples of time series are heights of ocean tides, counts of sunspots, and the daily closing value of the Dow Jones Industrial Average.

Trichromacy or trichromatism is the possessing of three independent channels for conveying color information, derived from the three different types of cone cells in the eye. Organisms with trichromacy are called trichromats.
Curve fitting is the process of constructing a curve, or mathematical function, that has the best fit to a series of data points, possibly subject to constraints. Curve fitting can involve either interpolation, where an exact fit to the data is required, or smoothing, in which a "smooth" function is constructed that approximately fits the data. A related topic is regression analysis, which focuses more on questions of statistical inference such as how much uncertainty is present in a curve that is fit to data observed with random errors. Fitted curves can be used as an aid for data visualization, to infer values of a function where no data are available, and to summarize the relationships among two or more variables. Extrapolation refers to the use of a fitted curve beyond the range of the observed data, and is subject to a degree of uncertainty since it may reflect the method used to construct the curve as much as it reflects the observed data.
FASTA is a DNA and protein sequence alignment software package first described by David J. Lipman and William R. Pearson in 1985. Its legacy is the FASTA format which is now ubiquitous in bioinformatics.

Marin Preda was a Romanian novelist, post-war writer and director of Cartea Românească publishing house. In 1970, Marin Preda was a staunch opponent of the communist regime, several voices confirming that the writer told Nicolae Ceaușescu "If you want to introduce socialist realism, I, Marin Preda, will kill myself". His last novel, published in 1980, "Cel mai iubit dintre pământeni", is considered a profound critique of the communism. At the time of his death, Marin Preda was a member of the Great National Assembly.
A color model is an abstract mathematical model describing the way colors can be represented as tuples of numbers, typically as three or four values or color components. When this model is associated with a precise description of how the components are to be interpreted, the resulting set of colors is called "color space." This section describes ways in which human color vision can be modeled.
The CIE 1931 color spaces are the first defined quantitative links between distributions of wavelengths in the electromagnetic visible spectrum, and physiologically perceived colors in human color vision. The mathematical relationships that define these color spaces are essential tools for color management, important when dealing with color inks, illuminated displays, and recording devices such as digital cameras. The system was designed in 1931 by the "Commission Internationale de l'éclairage", known in English as the International Commission on Illumination.

OrCAD Systems Corporation was a software company that made OrCAD, a proprietary software tool suite used primarily for electronic design automation (EDA). The software is used mainly by electronic design engineers and electronic technicians to create electronic schematics, perform mixed-signal simulation and electronic prints for manufacturing printed circuit boards. OrCAD was taken over by Cadence Design Systems in 1999 and was integrated with Cadence Allegro since 2005.
FlexPro is a software package for analysis and presentation of scientific and technical data, produced by Weisang GmbH. It runs on Microsoft Windows and is available in English, German, Japanese, Chinese and French. FlexPro has its roots in the test and measurement domain and supports different binary file formats of data acquisition instruments and software. In particular, FlexPro can analyze large amounts of data with high sampling rates.
Hilbert R-tree, an R-tree variant, is an index for multidimensional objects such as lines, regions, 3-D objects, or high-dimensional feature-based parametric objects. It can be thought of as an extension to B+-tree for multidimensional objects.

Airborne Real-time Cueing Hyperspectral Enhanced Reconnaissance, also known by the acronym ARCHER, is an aerial imaging system that produces ground images far more detailed than plain sight or ordinary aerial photography can. It is the most sophisticated unclassified hyperspectral imaging system available, according to U.S. Government officials. ARCHER can automatically scan detailed imaging for a given signature of the object being sought, for abnormalities in the surrounding area, or for changes from previous recorded spectral signatures.

The evolution of color vision in primates is unique compared to most eutherian mammals. A remote vertebrate ancestor of primates possessed tetrachromacy, but nocturnal, warm-blooded, mammalian ancestors lost two of four cones in the retina at the time of dinosaurs. Most teleost fish, reptiles and birds are therefore tetrachromatic while most mammals are strictly dichromats, the exceptions being some primates and marsupials, who are trichromats, and many marine mammals, who are monochromats.
A Tristimulus colorimeter, colloquially shortened to colorimeter, is used in digital imaging, to profile and calibrate output devices. It takes a limited number of wideband spectral energy readings along the visible spectrum by using filtered photodetectors; e.g. silicon photodiodes.
References
- ↑ Razvan Ion M. Preda, Maria Marcela Savu, Aurelia Meghea, Corneliu Tarabasanu-Mihaila, "Mathematical model for colour matching applied in sheepskin dyeing", IULTCS Centenary Congress, London 1997, Congress Proceedings, 798-803.
- ↑ Maria Marcela Savu, Razvan Ion Preda, Florin Vrejoiu, "Determination of whiteness degree for various leather support, 11th Congress of the Leather and Shoe Industries, Hungary 1998, 451"
- ↑ Razvan Ion M. Preda, Mircea Popescu, "True RGB colour analysis", Chemistry and Chemical Engineering Conference, Bucharest 1998, Conference Proceedings, vol. 2, 437-441