Multivariate statistics is a subdivision of statistics encompassing the simultaneous observation and analysis of more than one outcome variable, i.e., multivariate random variables. Multivariate statistics concerns understanding the different aims and background of each of the different forms of multivariate analysis, and how they relate to each other. The practical application of multivariate statistics to a particular problem may involve several types of univariate and multivariate analyses in order to understand the relationships between variables and their relevance to the problem being studied.
The following outline is provided as an overview of and topical guide to statistics:
Nonparametric statistics is a type of statistical analysis that makes minimal assumptions about the underlying distribution of the data being studied. Often these models are infinite-dimensional, rather than finite dimensional, as is parametric statistics. Nonparametric statistics can be used for descriptive statistics or statistical inference. Nonparametric tests are often used when the assumptions of parametric tests are evidently violated.

A Z-test is any statistical test for which the distribution of the test statistic under the null hypothesis can be approximated by a normal distribution. Z-test tests the mean of a distribution. For each significance level in the confidence interval, the Z-test has a single critical value which makes it more convenient than the Student's t-test whose critical values are defined by the sample size. Both the Z-test and Student's t-test have similarities in that they both help determine the significance of a set of data. However, the z-test is rarely used in practice because the population deviation is difficult to determine.
In statistics, the Mann–Whitney U test is a nonparametric test of the null hypothesis that, for randomly selected values X and Y from two populations, the probability of X being greater than Y is equal to the probability of Y being greater than X.
A t-test is a statistical hypothesis test used to test whether the difference between the response of two groups is statistically significant or not. It is any statistical hypothesis test in which the test statistic follows a Student's t-distribution under the null hypothesis. It is most commonly applied when the test statistic would follow a normal distribution if the value of a scaling term in the test statistic were known. When the scaling term is estimated based on the data, the test statistic—under certain conditions—follows a Student's t distribution. The t-test's most common application is to test whether the means of two populations are different. In many cases, a Z-test will yield very similar results to a t-test since the latter converges to the former as the size of the dataset increases.

In statistics, multivariate analysis of variance (MANOVA) is a procedure for comparing multivariate sample means. As a multivariate procedure, it is used when there are two or more dependent variables, and is often followed by significance tests involving individual dependent variables separately.

Mathematical statistics is the application of probability theory, a branch of mathematics, to statistics, as opposed to techniques for collecting statistical data. Specific mathematical techniques which are used for this include mathematical analysis, linear algebra, stochastic analysis, differential equations, and measure theory.

The Kruskal–Wallis test by ranks, Kruskal–Wallis H test, or one-way ANOVA on ranks is a non-parametric method for testing whether samples originate from the same distribution. It is used for comparing two or more independent samples of equal or different sample sizes. It extends the Mann–Whitney U test, which is used for comparing only two groups. The parametric equivalent of the Kruskal–Wallis test is the one-way analysis of variance (ANOVA).
A permutation test is an exact statistical hypothesis test making use of the proof by contradiction. A permutation test involves two or more samples. The null hypothesis is that all samples come from the same distribution . Under the null hypothesis, the distribution of the test statistic is obtained by calculating all possible values of the test statistic under possible rearrangements of the observed data. Permutation tests are, therefore, a form of resampling.
In statistics, an exact (significance) test is a test such that if the null hypothesis is true, then all assumptions made during the derivation of the distribution of the test statistic are met. Using an exact test provides a significance test that maintains the type I error rate of the test at the desired significance level of the test. For example, an exact test at a significance level of , when repeated over many samples where the null hypothesis is true, will reject at most of the time. This is in contrast to an approximate test in which the desired type I error rate is only approximately maintained, while this approximation may be made as close to as desired by making the sample size sufficiently large.
The sign test is a statistical method to test for consistent differences between pairs of observations, such as the weight of subjects before and after treatment. Given pairs of observations for each subject, the sign test determines if one member of the pair tends to be greater than the other member of the pair.
In statistics, resampling is the creation of new samples based on one observed sample. Resampling methods are:
- Permutation tests
- Bootstrapping
- Cross validation

In statistics, Fisher's method, also known as Fisher's combined probability test, is a technique for data fusion or "meta-analysis" (analysis of analyses). It was developed by and named for Ronald Fisher. In its basic form, it is used to combine the results from several independence tests bearing upon the same overall hypothesis (H0).
Detrended correspondence analysis (DCA) is a multivariate statistical technique widely used by ecologists to find the main factors or gradients in large, species-rich but usually sparse data matrices that typify ecological community data. DCA is frequently used to suppress artifacts inherent in most other multivariate analyses when applied to gradient data.

In statistics, the Goldfeld–Quandt test checks for homoscedasticity in regression analyses. It does this by dividing a dataset into two parts or groups, and hence the test is sometimes called a two-group test. The Goldfeld–Quandt test is one of two tests proposed in a 1965 paper by Stephen Goldfeld and Richard Quandt. Both a parametric and nonparametric test are described in the paper, but the term "Goldfeld–Quandt test" is usually associated only with the former.
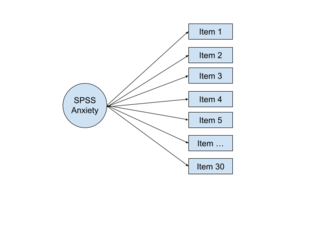
In multivariate statistics, exploratory factor analysis (EFA) is a statistical method used to uncover the underlying structure of a relatively large set of variables. EFA is a technique within factor analysis whose overarching goal is to identify the underlying relationships between measured variables. It is commonly used by researchers when developing a scale and serves to identify a set of latent constructs underlying a battery of measured variables. It should be used when the researcher has no a priori hypothesis about factors or patterns of measured variables. Measured variables are any one of several attributes of people that may be observed and measured. Examples of measured variables could be the physical height, weight, and pulse rate of a human being. Usually, researchers would have a large number of measured variables, which are assumed to be related to a smaller number of "unobserved" factors. Researchers must carefully consider the number of measured variables to include in the analysis. EFA procedures are more accurate when each factor is represented by multiple measured variables in the analysis.
In statistics, one purpose for the analysis of variance (ANOVA) is to analyze differences in means between groups. The test statistic, F, assumes independence of observations, homogeneous variances, and population normality. ANOVA on ranks is a statistic designed for situations when the normality assumption has been violated.
Permutational multivariate analysis of variance (PERMANOVA), is a non-parametric multivariate statistical permutation test. PERMANOVA is used to compare groups of objects and test the null hypothesis that the centroids and dispersion of the groups as defined by measure space are equivalent for all groups. A rejection of the null hypothesis means that either the centroid and/or the spread of the objects is different between the groups. Hence the test is based on the prior calculation of the distance between any two objects included in the experiment. PERMANOVA shares some resemblance to ANOVA where they both measure the sum-of-squares within and between group and make use of F test to compare within-group to between-group variance. However, while ANOVA bases the significance of the result on assumption of normality, PERMANOVA draws tests for significance by comparing the actual F test result to that gained from random permutations of the objects between the groups. Moreover, whilst PERMANOVA tests for similarity based on a chosen distance measure, ANOVA tests for similarity of the group averages.
