Results maps
 1995 results map
 1999 results map
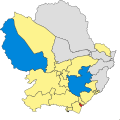 2003 results map
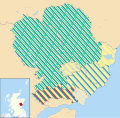 2012 results map
 2017 results map
 2022 results map
Angus Council in Scotland holds elections every five years, previously holding them every four years from its creation as a single-tier authority in 1995 to 2007.
| Year | SNP | Conservative | Labour | Liberal Democrats | Independent |
|---|---|---|---|---|---|
| 1974 | 0 | 9 | 3 | 0 | 10 |
| 1977 | 0 | 12 | 3 | 0 | 7 |
| 1980 | 5 | 11 | 2 | 0 | 4 |
| 1984 [a] | 11 | 8 | 0 | 0 | 2 |
| 1988 | 13 | 6 | 0 | 1 | 2 |
| 1992 | 11 | 7 | 0 | 1 | 2 |
| Year | SNP | Conservative | Labour | Liberal Democrats | Brechin Independent Group | Independent |
|---|---|---|---|---|---|---|
| 1995 | 21 | 2 | 0 | 2 | 0 | 1 |
| 1999 [a] | 21 | 2 | 1 | 2 | 2 | 1 |
| 2003 | 17 | 2 | 1 | 3 | 0 | 6 |
| 2007 [b] | 13 | 5 | 2 | 3 | 0 | 6 |
| 2012 | 15 | 4 | 1 | 1 | 0 | 8 |
| 2017 [c] | 9 | 8 | 0 | 2 | 0 | 9 |
| 2022 | 13 | 7 | 1 | 0 | 0 | 7 |


| Party | Candidate | FPv% | Count | |
|---|---|---|---|---|
| 1 | ||||
| SNP | Jean Lee | 68.6 | 2,486 | |
| Conservative | Craig Fotheringham | 19.3 | 698 | |
| Liberal Democrats | Charles Goodall | 12.1 | 439 | |
| SNP hold | ||||
| Valid: 3,623 Spoilt: 34 Quota: 1,829 Turnout: 3,657 | ||||
| Party | Candidate | FPv% | Count | |||||
|---|---|---|---|---|---|---|---|---|
| 1 | 2 | 3 | 4 | 5 | ||||
| Independent | Brian Boyd | 40.27 | 1,252 | 1,290 | 1,370 | 1,454 | 2,113 | |
| SNP | Ed Oswald | 41.46 | 1,289 | 1,302 | 1,346 | 1,426 | ||
| Labour | Ron Thoms | 8.3 | 258 | 266 | 287 | |||
| Conservative | Eddie Wilmott | 7.0 | 217 | 234 | ||||
| Liberal Democrats | Charles Goodall | 2.9 | 93 | |||||
| Independent gain from SNP | ||||||||
| Valid: 3,109 Spoilt: 19 Quota: 1,555 Turnout: 3,128 | ||||||||
| Party | Candidate | FPv% | Count | ||||||
|---|---|---|---|---|---|---|---|---|---|
| 1 | 2 | 3 | 4 | 5 | 6 | ||||
| SNP | Brenda Durno | 35.0 | 919 | 925 | 956 | 1,010 | 1,172 | 1,357 | |
| Conservative | Derek Wann | 27.0 | 709 | 723 | 741 | 799 | 928 | ||
| Independent | Lois Speed | 17.2 | 452 | 457 | 482 | 619 | |||
| Independent | Kevin Smith | 11.8 | 309 | 315 | 352 | ||||
| Labour | John Ruddy | 6.7 | 177 | 191 | |||||
| Liberal Democrats | Richard Moore | 2.3 | 60 | ||||||
| SNP gain from Independent | |||||||||
| Valid: 2,626 Spoilt: 42 Quota: 1,314 Turnout: 2,668 | |||||||||
| Party | Candidate | FPv% | Count | ||||
|---|---|---|---|---|---|---|---|
| 1 | 2 | 3 | 4 | ||||
| Independent | David Cheape | 43.5 | 1,401 | 1,420 | 1,477 | 1,737 | |
| SNP | Mark McDonald | 32.1 | 1,033 | 1,043 | 1,078 | 1,117 | |
| Conservative | Derek Shaw | 17.7 | 568 | 586 | 606 | ||
| Labour | Ray Strachan | 4.4 | 141 | 151 | |||
| Liberal Democrats | Beth Morrison | 2.3 | 75 | ||||
| Independent gain from SNP | |||||||
| Valid: 3,218 Spoilt: 28 Quota: 1,610 Turnout: 3,246 | |||||||
| Party | Candidate | FPv% | Count | |||||
|---|---|---|---|---|---|---|---|---|
| 1 | 2 | 3 | 4 | 5 | ||||
| Conservative | James Cruickshanks | 41.9 | 1,682 | 1,691 | 1,759 | 1,997 | 2,450 | |
| SNP | Kathleen Wolf | 29.3 | 1,175 | 1,237 | 1,279 | 1,467 | ||
| Labour | Mark Hilton | 16.0 | 644 | 676 | 833 | |||
| Liberal Democrats | Sandra O'Shea | 8.3 | 333 | 375 | ||||
| Scottish Green | Mark Findlay | 4.4 | 176 | |||||
| Conservative gain from Independent | ||||||||
| Valid: 4,010 Spoilt: 45 Quota: 2,006 Turnout: 4,055 | ||||||||
{{cite web}}: CS1 maint: archived copy as title (link)