Related Research Articles

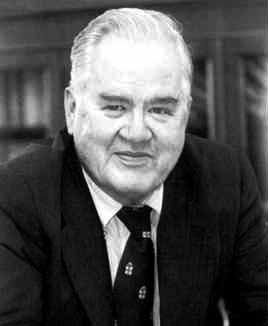
John Wilder Tukey was an American mathematician and statistician, best known for the development of the fast Fourier Transform (FFT) algorithm and box plot. The Tukey range test, the Tukey lambda distribution, the Tukey test of additivity, and the Teichmüller–Tukey lemma all bear his name. He is also credited with coining the term 'bit' and the first published use of the word 'software'.
In statistics, exploratory data analysis (EDA) is an approach of analyzing data sets to summarize their main characteristics, often using statistical graphics and other data visualization methods. A statistical model can be used or not, but primarily EDA is for seeing what the data can tell us beyond the formal modeling and thereby contrasts traditional hypothesis testing. Exploratory data analysis has been promoted by John Tukey since 1970 to encourage statisticians to explore the data, and possibly formulate hypotheses that could lead to new data collection and experiments. EDA is different from initial data analysis (IDA), which focuses more narrowly on checking assumptions required for model fitting and hypothesis testing, and handling missing values and making transformations of variables as needed. EDA encompasses IDA.

Sir David John Spiegelhalter is a British statistician and a Fellow of Churchill College, Cambridge. From 2007 to 2018 he was Winton Professor of the Public Understanding of Risk in the Statistical Laboratory at the University of Cambridge. Spiegelhalter is an ISI highly cited researcher.

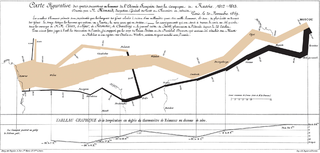
Data and information visualization is the practice of designing and creating easy-to-communicate and easy-to-understand graphic or visual representations of a large amount of complex quantitative and qualitative data and information with the help of static, dynamic or interactive visual items. Typically based on data and information collected from a certain domain of expertise, these visualizations are intended for a broader audience to help them visually explore and discover, quickly understand, interpret and gain important insights into otherwise difficult-to-identify structures, relationships, correlations, local and global patterns, trends, variations, constancy, clusters, outliers and unusual groupings within data. When intended for the general public to convey a concise version of known, specific information in a clear and engaging manner, it is typically called information graphics.

Michael Louis Friendly is an American-Canadian psychologist, Professor of Psychology at York University in Ontario, Canada, and director of its Statistical Consulting Service, especially known for his contributions to graphical methods for categorical and multivariate data, and on the history of data and information visualisation.

Leland Wilkinson was an American statistician and computer scientist at H2O.ai and Adjunct Professor of Computer Science at University of Illinois at Chicago. Wilkinson developed the SYSTAT statistical package in the early 1980s, sold it to SPSS in 1995, and worked at SPSS for 10 years recruiting and managing the visualization team. He left SPSS in 2008 and became Executive VP of SYSTAT Software Inc. in Chicago. He then served as the VP of Data Visualization at Skytree, Inc and VP of Statistics at Tableau Software before joining H2O.ai. His research focused on scientific visualization and statistical graphics. In these communities he was well known for his book The Grammar of Graphics, which was the foundation for the R package ggplot2.
Frederic Gordon Foster was an Irish computational engineer, statistician, professor, and college dean who is widely known for devising, in 1965, a nine-digit code upon which the International Standard Book Number (ISBN) is based.
Jun S. Liu is a Chinese-American statistician focusing on Bayesian statistical inference and computational biology. He received the COPSS Presidents' Award in 2002. Liu is a professor in the Department of Statistics at Harvard University and has written many research papers and a book about Markov chain Monte Carlo algorithms, including their applications in biology. He is also co-author of the Tmod software for sequence motif discovery.

Data science is an interdisciplinary academic field that uses statistics, scientific computing, scientific methods, processes, algorithms and systems to extract or extrapolate knowledge and insights from noisy, structured, and unstructured data.

Hadley Alexander Wickham is a New Zealand statistician known for his work on open-source software for the R statistical programming environment. He is the chief scientist at Posit, PBC and an adjunct professor of statistics at the University of Auckland, Stanford University, and Rice University. His work includes the data visualisation system ggplot2 and the tidyverse, a collection of R packages for data science based on the concept of tidy data.
Yihui Xie is a Chinese statistician, data scientist and software engineer for RStudio. He is the principal author of the open-source software package Knitr for data analysis in the R programming language, and has also written the book Dynamic Documents with R and knitr.
Heike Hofmann is a statistician and Professor in the Department of Statistics at Iowa State University.
Dianne Helen Cook is an Australian statistician, the editor of the Journal of Computational and Graphical Statistics, and an expert on the visualization of high-dimensional data. She is Professor of Business Analytics in the Department of Econometrics and Business Statistics at Monash University and professor emeritus of statistics at Iowa State University. The emeritus status was chosen so that she could continue to supervise graduate students at Iowa State after moving to Australia.
Deborah F. Swayne is an American statistician who worked for AT&T Labs and chaired the Section on Statistical Graphics of the American Statistical Association. She is known for her work as coauthor of GGobi, a software tool for interactive data visualization, and is president of the GGobi Foundation. She retired in 2016.
Deborah A. Nolan is an American statistician and statistics educator. She is a professor of statistics at the University of California, Berkeley, where she chairs the department of statistics.
Jiayang Sun is an American statistician whose research has included work on simultaneous confidence bands for multiple comparisons, selection bias, mixture models, Gaussian random fields, machine learning, big data, statistical computing, graphics, and applications in biostatistics, biomedical research, software bug tracking, astronomy, and intellectual property law. She is a statistics professor, Bernard J. Dunn Eminent Scholar, and chair of the statistics department at George Mason University, and a former president of the Caucus for Women in Statistics.
Andreas Buja is a Swiss statistician and professor of statistics. He is the Liem Sioe Liong/First Pacific Company professor in the Statistics department of The Wharton School at the University of Pennsylvania in Philadelphia, United States. Buja joined Center for Computational Mathematics (CCM) as a Senior Research Scientist in January 2020.
Nathaniel Dean was an African-American mathematician and educator who made contributions to abstract and algorithmic graph theory, as well as data visualization and parallel computing.
Linda Williams Pickle is an American statistician and expert in spatial analysis and data visualization, especially as applied to disease patterns. She worked as a researcher for the National Cancer Institute, for Georgetown University, and for the National Center for Health Statistics before becoming a statistics consultant and adjunct professor of geography and public health services at Pennsylvania State University.
References
- ↑ See Mathematics Genealogy Project (retrieved 2021-08-31).
- ↑ Walt Hickey: "Stats Legend Andrew Gelman Explains What Makes For Great Charts And Graphs, And How You're Doing It All Wrong", Business Insider, 3 December 2012 (retrieved 2021-08-31).
- ↑ Anne Quito and Dan Kopf: "Designers and statisticians disagree on what makes a good information graphic", Quartz, 12 January 2020 (retrieved 2021-08-31).