Application performance management

Last updated

In the fields of information technology and systems management, application performance management (APM) is the monitoring and management of the performance and availability of software applications. APM strives to detect and diagnose complex application performance problems to maintain an expected level of service. APM is "the translation of IT metrics into business meaning ([i.e.] value)." [1]

Contents

Measuring application performance

Two sets of performance metrics are closely monitored. The first set of performance metrics defines the performance experienced by end-users of the application. One example of performance is average response times under peak load. The components of the set include load and response times:

  • The load is the volume of transactions processed by the application, e.g., transactions per second, requests per second, pages per second. Without being loaded by computer-based demands (e.g. searches, calculations, transmissions), most applications are fast enough, which is why programmers may not catch performance problems during development.
  • The response times are the times required for an application to respond to a user's actions at such a load. [2]

The second set of performance metrics measures the computational resources used by the application for the load, indicating whether there is adequate capacity to support the load, as well as possible locations of a performance bottleneck. Measurement of these quantities establishes an empirical performance baseline for the application. The baseline can then be used to detect changes in performance. Changes in performance can be correlated with external events and subsequently used to predict future changes in application performance. [3]

The use of APM is common for Web applications, which lends itself best to the more detailed monitoring techniques. [4] In addition to measuring response time for a user, response times for components of a Web application can also be monitored to help pinpoint causes of delay. There also exist HTTP appliances that can decode transaction-specific response times at the Web server layer of the application.

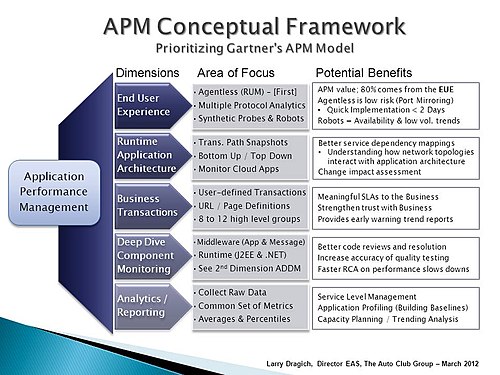
In their APM Conceptual Framework, Gartner Research describes five dimensions of APM: [5] [6] [7] [8]

In 2016, Gartner Research has updated its definition, into three main functional dimensions: [9]

Current issues

Since the first half of 2013, APM has entered into a period of intense competition in technology and strategy with a multiplicity of vendors and viewpoints. [10] This has caused an upheaval in the marketplace with vendors from unrelated backgrounds (including network monitoring, [11] systems management, application instrumentation, and web performance monitoring) adopting messaging around APM[ which? ]. As a result, the term APM has become diluted and has evolved into a concept for managing application performance across many diverse computing platforms, rather than a single market.[ clarification needed ] [12] With so many vendors to choose from, selecting one can be a challenge. It is important to evaluate each carefully to ensure its capabilities meet your needs. [13]

Two challenges for implementing APM are (1) it can be difficult to instrument an application to monitor application performance, especially among components of an application, and (2) applications can be virtualized, which increases the variability of the measurements. [14] [15] To alleviate the first problem application service management (ASM) provides an application-centric approach, where business service performance visibility is a key objective. The second aspect present in distributed, virtual and cloud-based applications poses a unique challenge for application performance monitoring because most of the key system components are no longer hosted on a single machine. Each function is now likely to have been designed as an Internet service that runs on multiple virtualized systems. The applications themselves are very likely to be moving from one system to another to meet service-level objectives and deal with momentary outages. [16]

The APM conceptual framework

Applications themselves are becoming increasingly difficult to manage as they move toward highly distributed, multi-tier, multi-element constructs that in many cases rely on application development frameworks such as .NET or Java. [17] The APM Conceptual Framework was designed to help prioritize an approach on what to focus on first for quick implementation and overall understanding of the five-dimensional APM model. The framework slide outlines three areas of focus for each dimension and describes their potential benefits. These areas are referenced as "Primary" below, with the lower priority dimensions referenced as "Secondary. " [18]

End user experience (primary)

Measuring the transit of traffic from user request to data and back again is part of capturing the end-user experience (EUE). [19] The outcome of this measuring is referred to as Real-time Application monitoring (aka Top-Down monitoring), which has two components, passive and active. Passive monitoring is usually an agentless appliance implemented using network port mirroring. A key feature to consider is the ability to support multi-component analytics (e.g., database, client/browser). Active monitoring, on the other hand, consists of synthetic probes and web robots predefined to report system availability and business transactions. Active monitoring is a good complement to passive monitoring; together, these two components help provide visibility into application health during off-peak hours when transaction volume is low.

This slide outlines three areas of focus for each dimension and describes their potential benefits. APM Conceptual Framework.jpg
This slide outlines three areas of focus for each dimension and describes their potential benefits.

User experience management (UEM) is a subcategory that emerged from the EUE dimension to monitor the behavioral context of the user. UEM, as practiced today, goes beyond availability to capture latencies and inconsistencies as human beings interact with applications and other services. [20] UEM is usually agent-based and may include JavaScript injection to monitor the end-user device. UEM is considered another facet of Real-time Application monitoring.

Runtime application architecture (secondary)

Application Discovery and Dependency Mapping (ADDM) offerings exist to automate the process of mapping transactions and applications to underlying infrastructure components. [21] When preparing to implement a runtime application architecture, it is necessary to ensure that up/down monitoring is in place for all nodes and servers within the environment (aka, bottom-up monitoring). This helps lay the foundation for event correlation and provides the basis for a general understanding of how network topologies interact with application architectures.

Business transaction (primary)

Focus on user-defined transactions or the URL page definitions that have some meaning to the business community. For example, if there are 200 to 300 unique page definitions for a given application, group them into 8–12 high-level categories. This allows for meaningful SLA reports, and provides trending information on application performance from a business perspective: start with broad categories and refine them over time. For a deeper understanding, see Business transaction management.

Deep dive component monitoring (secondary)

Deep dive component monitoring (DDCM) requires an agent installation and is generally targeted at middleware, focusing on web, application, and messaging servers. It should provide a real-time view of the J2EE and .NET stacks, tying them back to the user-defined business transactions. A robust monitor shows a clear path from code execution (e.g., spring and struts) to the URL rendered, and finally to the user request. Since DDCM is closely related to the second dimension in the APM model, most products in this field also provide application discovery dependency mapping (ADDM) as part of their offering.

Analytics/reporting (primary)

It is important to arrive at a common set of metrics to collect and report on for each application, then standardize on a common view on how to present the application performance data. Collecting raw data from the other tool sets across the APM model provides flexibility in application reporting. This allows for answering a wide variety of performance questions as they arise, despite the different platforms each application may be running on. Too much information is overwhelming. That is why it is important to keep reports simple or they won't be used. [22]

See also

Related Research Articles

<span class="mw-page-title-main">Data warehouse</span> Centralized storage of knowledge

In computing, a data warehouse, also known as an enterprise data warehouse (EDW), is a system used for reporting and data analysis and is considered a core component of business intelligence. Data warehouses are central repositories of integrated data from one or more disparate sources. They store current and historical data in one single place that are used for creating analytical reports for workers throughout the enterprise. This is beneficial for companies as it enables them to interrogate and draw insights from their data and make decisions.

Italic text

<span class="mw-page-title-main">Extract, transform, load</span> Procedure in computing

In computing, extract, transform, load (ETL) is a three-phase process where data is extracted, transformed and loaded into an output data container. The data can be collated from one or more sources and it can also be output to one or more destinations. ETL processing is typically executed using software applications but it can also be done manually by system operators. ETL software typically automates the entire process and can be run manually or on reoccurring schedules either as single jobs or aggregated into a batch of jobs.

Systems management refers to enterprise-wide administration of distributed systems including computer systems. Systems management is strongly influenced by network management initiatives in telecommunications. The application performance management (APM) technologies are now a subset of Systems management. Maximum productivity can be achieved more efficiently through event correlation, system automation and predictive analysis which is now all part of APM.

Capacity management's goal is to ensure that information technology resources are sufficient to meet upcoming business requirements cost-effectively. One common interpretation of capacity management is described in the ITIL framework. ITIL version 3 views capacity management as comprising three sub-processes: business capacity management, service capacity management, and component capacity management.

Website monitoring is the process of testing and verifying that end-users can interact with a website or web application as expected. Website monitoring are often used by businesses to ensure website uptime, performance, and functionality is as expected.

In software design, web design, and electronic product design, synthetic monitoring is a monitoring technique that is done by using a simulation or scripted recordings of transactions. Behavioral scripts are created to simulate an action or path that a customer or end user would take on a site, application, or other software. Those paths are then continuously monitored at specified intervals for performance, such as functionality, availability, and response time measures.

Passive monitoring is a technique used to capture traffic from a network by copying traffic, often from a span port or mirror port or via a network tap. It can be used in application performance management for performance trending and predictive analysis. Passive monitoring is also used in web performance optimization in the form of real user monitoring. E-commerce and media industries use real user monitoring to correlate site performance to conversions and engagement.

Performance engineering encompasses the techniques applied during a systems development life cycle to ensure the non-functional requirements for performance will be met. It may be alternatively referred to as systems performance engineering within systems engineering, and software performance engineering or application performance engineering within software engineering.

Operational intelligence (OI) is a category of real-time dynamic, business analytics that delivers visibility and insight into data, streaming events and business operations. OI solutions run queries against streaming data feeds and event data to deliver analytic results as operational instructions. OI provides organizations the ability to make decisions and immediately act on these analytic insights, through manual or automated actions.

Business transaction management (BTM), also known as business transaction monitoring, application transaction profiling or user defined transaction profiling, is the practice of managing information technology (IT) from a business transaction perspective. It provides a tool for tracking the flow of transactions across IT infrastructure, in addition to detection, alerting, and correction of unexpected changes in business or technical conditions. BTM provides visibility into the flow of transactions across infrastructure tiers, including a dynamic mapping of the application topology.

Application service management (ASM) is an emerging discipline within systems management that focuses on monitoring and managing the performance and quality of service of business transactions.

Database activity monitoring is a database security technology for monitoring and analyzing database activity. DAM may combine data from network-based monitoring and native audit information to provide a comprehensive picture of database activity. The data gathered by DAM is used to analyze and report on database activity, support breach investigations, and alert on anomalies. DAM is typically performed continuously and in real-time.

Nastel Technologies is an information technology (IT) monitoring company that sells software for Artificial Intelligent IT Operations (AIOps), monitoring and managing middleware, transaction tracking and tracing, IT Operational Analytics (ITOA), Decision Support Systems (DSS) business transaction management (BTM) and application performance management (APM).

AppDynamics is a full-stack application performance management (APM) and IT operations analytics (ITOA) company based in San Francisco. The company focuses on managing the performance and availability of applications across cloud computing environments, IT infrastructure, network architecture, digital user experience design, application security threat detection, observability, and data centers. In March 2017, AppDynamics was acquired by Cisco for $3.7 billion. The software intelligence platform is used in enterprise and public sector SaaS applications such as the financial service sector, healthcare, telecom, manufacturing, and government for full-stack observability and IT infrastructure monitoring.

<span class="mw-page-title-main">Sumo Logic</span> U.S. information technology company

Sumo Logic, Inc. is a cloud-based machine data analytics company focusing on security, operations and BI use-cases. It provides log management and analytics services that use machine-generated big data. Sumo Logic was founded in April 2010 by ArcSight veterans Kumar Saurabh and Christian Beedgen, and is headquartered in Redwood City, California.

Wire data is the information that passes over computer and telecommunication networks defining communications between client and server devices. It is the result of decoding wire and transport protocols containing the bi-directional data payload. More precisely, wire data is the information that is communicated in each layer of the OSI model.

In the fields of information technology (IT) and systems management, IT operations analytics (ITOA) is an approach or method to retrieve, analyze, and report data for IT operations. ITOA may apply big data analytics to large datasets to produce business insights. In 2014, Gartner predicted its use might increase revenue or reduce costs. By 2017, it predicted that 15% of enterprises will use IT operations analytics technologies.

API management is the process of creating and publishing web application programming interfaces (APIs), enforcing their usage policies, controlling access, nurturing the subscriber community, collecting and analyzing usage statistics, and reporting on performance. API Management components provide mechanisms and tools to support developer and subscriber communities.

In IT operations, software performance management is the subset of tools and processes in IT Operations which deals with the collection, monitoring, and analysis of performance metrics. These metrics can indicate to IT staff whether a system component is up and running (available), or that the component is behaving in an abnormal way that would impact its ability to function correctly—much like how a doctor may measure pulse, respiration, and temperature to measure how the human body is "operating". This type of monitoring originated with computer network components, but has now expanded into monitoring other components such as servers and storage devices, as well as groups of components organized to deliver specific services and Business Service Management).

References

  1. Dragich, Larry (4 April 2012). "The Anatomy of APM – 4 Foundational Elements to a Successful Strategy". APM Digest.
  2. Dubie, Denise (2006-11-11). "Performance management from the client's point of view". NetworkWorld. Retrieved 22 March 2013.
  3. Dragich, Larry (11 May 2012). "APM and MoM - Symbiotic Solution Sets". APM Digest.
  4. "What You Should Know About APM – Part 1". Realtime NEXUS. 2013. Archived from the original on 2013-12-14.
  5. "Keep the Five Functional Dimensions of APM Distinct". Gartner Research (ID Number=G00206101). 16 September 2010. Archived from the original on July 11, 2011.
  6. "Analytics vs. APM". APM Digest. 28 January 2013.
  7. "A Comparison of Application Performance Management Suites from CA, HP and Oracle" (PDF). Crimson consulting group. Retrieved 22 March 2013.
  8. "Magic Quadrant for Application Performance Monitoring". Gartner. Retrieved 18 December 2013.
  9. "Magic Quadrant for Application Performance Monitoring Suites, 2016". Gartner Research (ID Number=G00298377). 21 December 2016.
  10. "APM Convergence: Monitoring vs. Management". APM Digest. 6 March 2013.
  11. "What Is Network Monitoring?". Ascendant Technologies, Inc. 2022-01-05. Retrieved 2022-01-09.
  12. "Application Performance Management Spectrum" (PDF). TRAC Research. 11 March 2013. Archived from the original (PDF) on 17 April 2013.
  13. "5 Capabilities to Consider When Selecting an Application Performance Monitoring Solution". APMdigest - Application Performance Management. 2017-04-03. Retrieved 2017-09-26.
  14. Khanna, Gunjan; Beaty, Kirk A.; Kar, Gautam; Kochut, Andrzej (2006). "Application Performance Management in Virtualized Server Environments". 2006 IEEE/IFIP Network Operations and Management Symposium NOMS 2006. Network Operations and Management Symposium, 2006. NOMS 2006. 10th IEEE/IFIP. pp. 373–381. doi:10.1109/NOMS.2006.1687567. ISBN   978-1-4244-0142-0. S2CID   14638468.
  15. Matchett, Mike. "Is Virtualization Stalled On Performance?". Virtualization Review. Retrieved 22 March 2013.
  16. "Differences between approaches to APM - a chat with Jesse Rothstein of Extrahop". ZDNet. 9 December 2011.
  17. "The Five Essential Elements of Application Performance Monitoring". Realtime NEXUS. 2010.
  18. "Priorizing Gartner's APM Model: The APM Conceptual Framework". APM Digest. 15 March 2012.
  19. "Application performance monitoring tools: Three vendor strategies". SearchNetworking. 25 March 2013.
  20. "Insight from the User Experience Management Panel in Boston". APM Digest. 23 March 2012.
  21. "Research and Markets: Radar for Application Discovery and Dependency Mapping (ADDM)". Business Wire. 19 May 2011.
  22. "Big Data and Advanced Analytics: Success Stories From the Front Lines". Forbes. 3 December 2012.