
In statistics (classical test theory), average variance extracted (AVE) is a measure of the amount of variance that is captured by a construct in relation to the amount of variance due to measurement error. [1]
In statistics (classical test theory), average variance extracted (AVE) is a measure of the amount of variance that is captured by a construct in relation to the amount of variance due to measurement error. [1]
The average variance extracted was first proposed by Fornell & Larcker (1981). [1]
The average variance extracted can be calculated as follows:
Here, is the number of items, the factor loading of item and the variance of the error of item .
The average variance extracted has often been used to assess discriminant validity based on the following "rule of thumb": the positive square root of the AVE for each of the latent variables should be higher than the highest correlation with any other latent variable. If that is the case, discriminant validity is established at the construct level. This rule is known as Fornell–Larcker criterion. However, in simulation models this criterion did not prove reliable for composite-based structural equation models (e.g., PLS-PM), [2] but indeed proved to be reliable for factor-based structural equation models (e.g., Amos, PLSF-SEM). [3] [4]
Related coefficients are tau-equivalent reliability (; traditionally known as "Cronbach's ") and congeneric reliability (; also known as composite reliability) which can be used to evaluate the reliability of tau-equivalent and congeneric measurement models, respectively.

In probability theory and statistics, variance is the expected value of the squared deviation from the mean of a random variable. The standard deviation (SD) is obtained as the square root of the variance. Variance is a measure of dispersion, meaning it is a measure of how far a set of numbers is spread out from their average value. It is the second central moment of a distribution, and the covariance of the random variable with itself, and it is often represented by , , , , or .

In probability theory and statistics, the exponential distribution or negative exponential distribution is the probability distribution of the distance between events in a Poisson point process, i.e., a process in which events occur continuously and independently at a constant average rate; the distance parameter could be any meaningful mono-dimensional measure of the process, such as time between production errors, or length along a roll of fabric in the weaving manufacturing process. It is a particular case of the gamma distribution. It is the continuous analogue of the geometric distribution, and it has the key property of being memoryless. In addition to being used for the analysis of Poisson point processes it is found in various other contexts.
In statistics, the Gauss–Markov theorem states that the ordinary least squares (OLS) estimator has the lowest sampling variance within the class of linear unbiased estimators, if the errors in the linear regression model are uncorrelated, have equal variances and expectation value of zero. The errors do not need to be normal, nor do they need to be independent and identically distributed. The requirement that the estimator be unbiased cannot be dropped, since biased estimators exist with lower variance. See, for example, the James–Stein estimator, ridge regression, or simply any degenerate estimator.
In statistics and psychometrics, reliability is the overall consistency of a measure. A measure is said to have a high reliability if it produces similar results under consistent conditions:
"It is the characteristic of a set of test scores that relates to the amount of random error from the measurement process that might be embedded in the scores. Scores that are highly reliable are precise, reproducible, and consistent from one testing occasion to another. That is, if the testing process were repeated with a group of test takers, essentially the same results would be obtained. Various kinds of reliability coefficients, with values ranging between 0.00 and 1.00, are usually used to indicate the amount of error in the scores."
Cronbach's alpha, also known as tau-equivalent reliability or coefficient alpha, is a reliability coefficient and a measure of the internal consistency of tests and measures. It was named after the American psychologist Lee Cronbach.
In probability theory, a compound Poisson distribution is the probability distribution of the sum of a number of independent identically-distributed random variables, where the number of terms to be added is itself a Poisson-distributed variable. The result can be either a continuous or a discrete distribution.

In probability and statistics, the Yule–Simon distribution is a discrete probability distribution named after Udny Yule and Herbert A. Simon. Simon originally called it the Yule distribution.
Variational Bayesian methods are a family of techniques for approximating intractable integrals arising in Bayesian inference and machine learning. They are typically used in complex statistical models consisting of observed variables as well as unknown parameters and latent variables, with various sorts of relationships among the three types of random variables, as might be described by a graphical model. As typical in Bayesian inference, the parameters and latent variables are grouped together as "unobserved variables". Variational Bayesian methods are primarily used for two purposes:
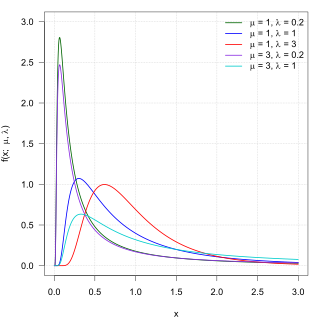
In probability theory, the inverse Gaussian distribution is a two-parameter family of continuous probability distributions with support on (0,∞).
In psychology, discriminant validity tests whether concepts or measurements that are not supposed to be related are actually unrelated.
A ratio distribution is a probability distribution constructed as the distribution of the ratio of random variables having two other known distributions. Given two random variables X and Y, the distribution of the random variable Z that is formed as the ratio Z = X/Y is a ratio distribution.
In statistics, a power transform is a family of functions applied to create a monotonic transformation of data using power functions. It is a data transformation technique used to stabilize variance, make the data more normal distribution-like, improve the validity of measures of association, and for other data stabilization procedures.
In statistics, confirmatory factor analysis (CFA) is a special form of factor analysis, most commonly used in social science research. It is used to test whether measures of a construct are consistent with a researcher's understanding of the nature of that construct. As such, the objective of confirmatory factor analysis is to test whether the data fit a hypothesized measurement model. This hypothesized model is based on theory and/or previous analytic research. CFA was first developed by Jöreskog (1969) and has built upon and replaced older methods of analyzing construct validity such as the MTMM Matrix as described in Campbell & Fiske (1959).
In probability and statistics, the Tweedie distributions are a family of probability distributions which include the purely continuous normal, gamma and inverse Gaussian distributions, the purely discrete scaled Poisson distribution, and the class of compound Poisson–gamma distributions which have positive mass at zero, but are otherwise continuous. Tweedie distributions are a special case of exponential dispersion models and are often used as distributions for generalized linear models.
In statistics, principal component regression (PCR) is a regression analysis technique that is based on principal component analysis (PCA). PCR is a form of reduced rank regression. More specifically, PCR is used for estimating the unknown regression coefficients in a standard linear regression model.
In probability theory, concentration inequalities provide mathematical bounds on the probability of a random variable deviating from some value. The deviation or other function of the random variable can be thought of as a secondary random variable. The simplest example of the concentration of such a secondary random variable is the CDF of the first random variable which concentrates the probability to unity. If an analytic form of the CDF is available this provides a concentration equality that provides the exact probability of concentration. It is precisely when the CDF is difficult to calculate or even the exact form of the first random variable is unknown that the applicable concentration inequalities provide useful insight.
SmartPLS is a software with graphical user interface for variance-based structural equation modeling (SEM) using the partial least squares (PLS) path modeling method. Users can estimate models with their data by using basic PLS-SEM, weighted PLS-SEM (WPLS), consistent PLS-SEM (PLSc-SEM), and sumscores regression algorithms. The software computes standard results assessment criteria and it supports additional statistical analyses . Since SmartPLS is programmed in Java, it can be executed and run on different computer operating systems such as Windows and Mac.
In statistical models applied to psychometrics, congeneric reliability a single-administration test score reliability coefficient, commonly referred to as composite reliability, construct reliability, and coefficient omega. is a structural equation model (SEM)-based reliability coefficients and is obtained from on a unidimensional model. is the second most commonly used reliability factor after tau-equivalent reliability(; also known as Cronbach's alpha), and is often recommended as its alternative.
A mixed Poisson distribution is a univariate discrete probability distribution in stochastics. It results from assuming that the conditional distribution of a random variable, given the value of the rate parameter, is a Poisson distribution, and that the rate parameter itself is considered as a random variable. Hence it is a special case of a compound probability distribution. Mixed Poisson distributions can be found in actuarial mathematics as a general approach for the distribution of the number of claims and is also examined as an epidemiological model. It should not be confused with compound Poisson distribution or compound Poisson process.
The Blackwell-Girshick equation is an equation in probability theory that allows for the calculation of the variance of random sums of random variables. It is the equivalent of Wald's lemma for the expectation of composite distributions.


