Related Research Articles

Gross domestic product (GDP) is a monetary measure of the market value of all the final goods and services produced in a specific time period. GDP (nominal) per capita does not, however, reflect differences in the cost of living and the inflation rates of the countries; therefore using a basis of GDP per capita at purchasing power parity (PPP) is arguably more useful when comparing living standards between nations, while nominal GDP is more useful comparing national economies on the international market.
An economic indicator is a statistic about an economic activity. Economic indicators allow analysis of economic performance and predictions of future performance. One application of economic indicators is the study of business cycles. Economic indicators include various indices, earnings reports, and economic summaries: for example, the unemployment rate, quits rate, housing starts, consumer price index, consumer leverage ratio, industrial production, bankruptcies, gross domestic product, broadband internet penetration, retail sales, stock market prices, and money supply changes.
In economics, the GDP deflator is a measure of the level of prices of all new, domestically produced, final goods and services in an economy in a year. GDP stands for gross domestic product, the total monetary value of all final goods and services produced within the territory of a country over a particular period of time.
Productivity describes various measures of the efficiency of production. Often, a productivity measure is expressed as the ratio of an aggregate output to a single input or an aggregate input used in a production process, i.e. output per unit of input, typically over a specific period of time. Most common example is the (aggregate) labour productivity measure, e.g., such as GDP per worker. There are many different definitions of productivity and the choice among them depends on the purpose of the productivity measurement and/or data availability. The key source of difference between various productivity measures is also usually related to how the outputs and the inputs are aggregated into scalars to obtain such a ratio-type measure of productivity.
A cost-of-living index is a theoretical price index that measures relative cost of living over time or regions. It is an index that measures differences in the price of goods and services, and allows for substitutions with other items as prices vary.
The official measure of producer prices in the United States is called the Producer Price Index (PPI). It measures average changes in prices received by domestic producers for their output. The PPI was known as the Wholesale Price Index, or WPI, up to 1978. The PPI is one of the oldest continuous systems of statistical data published by the Bureau of Labor Statistics, as well as one of the oldest economic time series compiled by the Federal Government. The origins of the index can be found in an 1891 U.S. Senate resolution authorizing the Senate Committee on Finance to investigate the effects of the tariff laws “upon the imports and exports, the growth, development, production, and prices of agricultural and manufactured articles at home and abroad.”
In the United Kingdom, the Retail Prices Index or Retail Price Index (RPI) is a measure of inflation published monthly by the Office for National Statistics. It measures the change in the cost of a representative sample of retail goods and services.
The Australian Bureau of Statistics (ABS) is the independent statistical agency of the Government of Australia. The ABS provides key statistics on a wide range of economic, population, environmental and social issues, to assist and encourage informed decision making, research and discussion within governments and the community.

Household income is an economic standard that can be applied to one household, or aggregated across a large group such as a county, city, or the whole country. It is commonly used by the United States government and private institutions to describe a household's economic status or to track economic trends in the US.

Personal income is an individual's total earnings from wages, investment interest, and other sources. The Bureau of Labor Statistics reported a median personal income of $865 weekly for all full-time workers in 2017. The U.S. Census Bureau lists the annual median personal income at $33,706 in 2018.
Produced by the Bureau of Labor Statistics (BLS) in the US Department of Labor, the National Compensation Survey (NCS) provides comprehensive measures of occupational earnings; compensation cost trends, benefit incidence, and detailed plan provisions. It is used to adjust the federal wage schedule for all federal employees. Detailed occupational earnings are available for metropolitan and non-metropolitan areas, broad geographic regions, and on a national basis. The index component of the NCS measures changes in labor costs. Average hourly employer cost for employee compensation is presented in the Employer Costs for Employee Compensation.

The minimum wage in the United States is set by U.S. labor law and a range of state and local laws. Employers generally have to pay workers the highest minimum wage prescribed by federal, state, and local law. Since July 24, 2009, the federal minimum wage is $7.25 per hour. As of January 2020, there were 29 states and D.C with a minimum wage higher than the federal minimum. From 2018 to 2019, seven states increased their minimum wage levels through automatic adjustments, while increases in sixteen other states and D.C. occurred through referendum or legislative action.
Wage differential is a term used in labour economics to analyze the relation between the wage rate and the unpleasantness, risk, or other undesirable attributes of a particular job. A compensating differential, which is also called a compensating wage differential or an equalizing difference, is defined as the additional amount of income that a given worker must be offered in order to motivate them to accept a given undesirable job, relative to other jobs that worker could perform. One can also speak of the compensating differential for an especially desirable job, or one that provides special benefits, but in this case the differential would be negative: that is, a given worker would be willing to accept a lower wage for an especially desirable job, relative to other jobs.

Median household disposable income in the UK was £29,400 in the financial year ending (FYE) 2019, up 1.4% (£400) compared with FYE 2018, after accounting for inflation.
This page lists details of the consumer price index by country
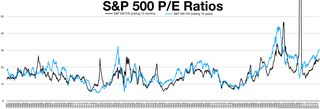
The cyclically adjusted price-to-earnings ratio, commonly known as CAPE, Shiller P/E, or P/E 10 ratio, is a valuation measure usually applied to the US S&P 500 equity market. It is defined as price divided by the average of ten years of earnings, adjusted for inflation. As such, it is principally used to assess likely future returns from equities over timescales of 10 to 20 years, with higher than average CAPE values implying lower than average long-term annual average returns.

The gender pay gap or gender wage gap is the average difference between the remuneration for men and women who are working. Women are generally considered to be paid less than men. There are two distinct numbers regarding the pay gap: non-adjusted versus adjusted pay gap. The latter typically takes into account differences in hours worked, occupations chosen, education and job experience. In the United States, for example, the non-adjusted average female's annual salary is 79% of the average male salary, compared to 95% for the adjusted average salary.
In the United Kingdom, the average earnings index (AEI) was an indicator of inflationary pressures emanating from the labour market.

The economy of the Australian Capital Territory (ACT) is the fastest-growing, sixth biggest economy of Australia as of the end of the 2017-18 financial year. Since the introduction of its self-government status in 1989, and with few exceptions in 1992, 1996, and 2014, the ACT economy has exhibited positive growth at a 1991-2018 average of 3.17 percent per year. A vast majority of the economy is concentrated in Canberra, the capital city of Australia, and is composed primarily by service industries, particularly those related to the administration of federal and local government. Construction also contributes to an important part of the economy, boosted by large government-funded projects and an active residential market. In contrast to other Australian states and territories, primary sectors such as agriculture, forestry, and mining, represent a very small proportion of the economy (±1%). A negative balance of trade has characterised the ACT economy since 2012-13, with small goods trade and a growing service export industry comprised mainly by education and public administration services.
References
- ↑ "Average Weekly Earnings" (PDF). Office for National Statistics. 18 November 2011. Retrieved 6 February 2014.
- ↑ "Average Weekly Earnings". The Office for National Statistics. Archived from the original on 6 February 2014. Retrieved 6 February 2014.
- 1 2 Australian Bureau of Statistics: 6302.0 – Average Weekly Earnings, Australia, May 2014 Quality Declaration