Related Research Articles
The logistic map is a polynomial mapping of degree 2, often referred to as an archetypal example of how complex, chaotic behaviour can arise from very simple nonlinear dynamical equations. The map was popularized in a 1976 paper by the biologist Robert May, in part as a discrete-time demographic model analogous to the logistic equation written down by Pierre François Verhulst. Mathematically, the logistic map is written
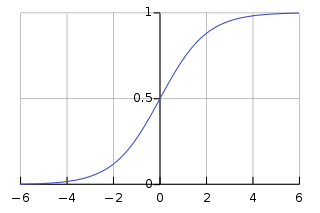
A logistic function or logistic curve is a common S-shaped curve with the equation

Exponential growth is a process that increases quantity over time. It occurs when the instantaneous rate of change of a quantity with respect to time is proportional to the quantity itself. Described as a function, a quantity undergoing exponential growth is an exponential function of time, that is, the variable representing time is the exponent. Exponential growth is the inverse of logarithmic growth.

In probability theory and statistics, the Gumbel distribution is used to model the distribution of the maximum of a number of samples of various distributions.
In population ecology and economics, maximum sustainable yield (MSY) is theoretically, the largest yield that can be taken from a species' stock over an indefinite period. Fundamental to the notion of sustainable harvest, the concept of MSY aims to maintain the population size at the point of maximum growth rate by harvesting the individuals that would normally be added to the population, allowing the population to continue to be productive indefinitely. Under the assumption of logistic growth, resource limitation does not constrain individuals' reproductive rates when populations are small, but because there are few individuals, the overall yield is small. At intermediate population densities, also represented by half the carrying capacity, individuals are able to breed to their maximum rate. At this point, called the maximum sustainable yield, there is a surplus of individuals that can be harvested because growth of the population is at its maximum point due to the large number of reproducing individuals. Above this point, density dependent factors increasingly limit breeding until the population reaches carrying capacity. At this point, there are no surplus individuals to be harvested and yield drops to zero. The maximum sustainable yield is usually higher than the optimum sustainable yield and maximum economic yield.
Population dynamics is the type of mathematics used to model and study the size and age composition of populations as dynamical systems.

Population ecology is a sub-field of ecology that deals with the dynamics of species populations and how these populations interact with the environment, such as birth and death rates, and by immigration and emigration.

When a quantity grows towards a singularity under a finite variation it is said to undergo hyperbolic growth. More precisely, the reciprocal function has a hyperbola as a graph, and has a singularity at 0, meaning that the limit as is infinite: any similar graph is said to exhibit hyperbolic growth.
Robust statistics are statistics with good performance for data drawn from a wide range of probability distributions, especially for distributions that are not normal. Robust statistical methods have been developed for many common problems, such as estimating location, scale, and regression parameters. One motivation is to produce statistical methods that are not unduly affected by outliers. Another motivation is to provide methods with good performance when there are small departures from a parametric distribution. For example, robust methods work well for mixtures of two normal distributions with different standard deviations; under this model, non-robust methods like a t-test work poorly.
The Gompertz curve or Gompertz function is a type of mathematical model for a time series, named after Benjamin Gompertz (1779–1865). It is a sigmoid function which describes growth as being slowest at the start and end of a given time period. The right-side or future value asymptote of the function is approached much more gradually by the curve than the left-side or lower valued asymptote. This is in contrast to the simple logistic function in which both asymptotes are approached by the curve symmetrically. It is a special case of the generalised logistic function. The function was originally designed to describe human mortality, but since has been modified to be applied in biology, with regard to detailing populations.
Biodemography is a multidisciplinary approach, integrating biological knowledge with demographic research on human longevity and survival. Biodemographic studies are important for understanding the driving forces of the current longevity revolution, forecasting the future of human longevity, and identification of new strategies for further increase in healthy and productive life span.
Latent growth modeling is a statistical technique used in the structural equation modeling (SEM) framework to estimate growth trajectories. It is a longitudinal analysis technique to estimate growth over a period of time. It is widely used in the field of psychology, behavioral science, education and social science. It is also called latent growth curve analysis. The latent growth model was derived from theories of SEM. General purpose SEM software, such as OpenMx, lavaan, AMOS, Mplus, LISREL, or EQS among others may be used to estimate growth trajectories.

Ole Eiler Barndorff-Nielsen was a Danish statistician who has contributed to many areas of statistical science.

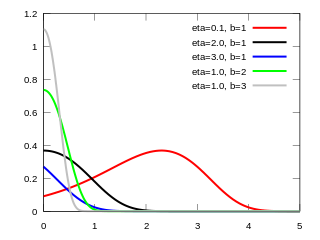
The shifted Gompertz distribution is the distribution of the larger of two independent random variables one of which has an exponential distribution with parameter and the other has a Gumbel distribution with parameters and . In its original formulation the distribution was expressed referring to the Gompertz distribution instead of the Gumbel distribution but, since the Gompertz distribution is a reverted Gumbel distribution, the labelling can be considered as accurate. It has been used as a model of adoption of innovations. It was proposed by Bemmaor (1994). Some of its statistical properties have been studied further by Jiménez and Jodrá (2009) and Jiménez Torres (2014).
In probability and statistics, the Gompertz distribution is a continuous probability distribution, named after Benjamin Gompertz. The Gompertz distribution is often applied to describe the distribution of adult lifespans by demographers and actuaries. Related fields of science such as biology and gerontology also considered the Gompertz distribution for the analysis of survival. More recently, computer scientists have also started to model the failure rates of computer code by the Gompertz distribution. In Marketing Science, it has been used as an individual-level simulation for customer lifetime value modeling. In network theory, particularly the Erdős–Rényi model, the walk length of a random self-avoiding walk (SAW) is distributed according to the Gompertz distribution.
The survival function is a function that gives the probability that a patient, device, or other object of interest will survive past a certain time. The survival function is also known as the survivor function or reliability function. The term reliability function is common in engineering while the term survival function is used in a broader range of applications, including human mortality. The survival function is the complementary cumulative distribution function of the lifetime. Sometimes complementary cumulative distribution functions are called survival functions in general.
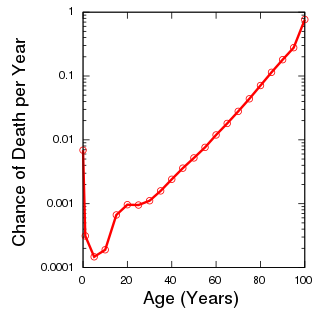
In gerontology, late-life mortality deceleration is the disputed theory that hazard rate increases at a decreasing rate in late life rather than increasing exponentially as in the Gompertz law.
References
Sources
- Kuhn, Moscibroda, and Wattenhofer, "On the Locality of Bounded Growth", ACM Symposium on Principles of Distributed Computing (PODC), July 17–20, 2005.
- Gilchrist, Warren, "Statistical Modelling", John Wiley & Sons, Chichester, UK, 1984.
| | This mathematical analysis–related article is a stub. You can help Wikipedia by expanding it. |