
In statistics, a normal distribution or Gaussian distribution is a type of continuous probability distribution for a real-valued random variable. The general form of its probability density function is

In probability theory and statistics, skewness is a measure of the asymmetry of the probability distribution of a real-valued random variable about its mean. The skewness value can be positive, zero, negative, or undefined.
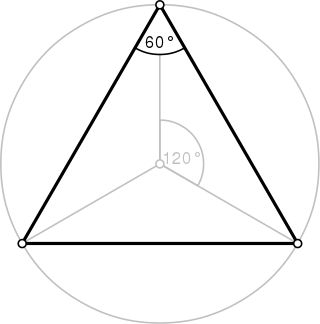
A triangle is a polygon with three edges and three vertices. It is one of the basic shapes in geometry. A triangle with vertices A, B, and C is denoted .

In mathematics, a ratio shows how many times one number contains another. For example, if there are eight oranges and six lemons in a bowl of fruit, then the ratio of oranges to lemons is eight to six. Similarly, the ratio of lemons to oranges is 6:8 and the ratio of oranges to the total amount of fruit is 8:14.

In statistics, correlation or dependence is any statistical relationship, whether causal or not, between two random variables or bivariate data. Although in the broadest sense, "correlation" may indicate any type of association, in statistics it usually refers to the degree to which a pair of variables are linearly related. Familiar examples of dependent phenomena include the correlation between the height of parents and their offspring, and the correlation between the price of a good and the quantity the consumers are willing to purchase, as it is depicted in the so-called demand curve.

In statistics, the Pearson correlation coefficient ― also known as Pearson's r, the Pearson product-moment correlation coefficient (PPMCC), the bivariate correlation, or colloquially simply as the correlation coefficient ― is a measure of linear correlation between two sets of data. It is the ratio between the covariance of two variables and the product of their standard deviations; thus, it is essentially a normalized measurement of the covariance, such that the result always has a value between −1 and 1. As with covariance itself, the measure can only reflect a linear correlation of variables, and ignores many other types of relationships or correlations. As a simple example, one would expect the age and height of a sample of teenagers from a high school to have a Pearson correlation coefficient significantly greater than 0, but less than 1.

In statistics, the logistic model is a statistical model that models the probability of an event taking place by having the log-odds for the event be a linear combination of one or more independent variables. In regression analysis, logistic regression is estimating the parameters of a logistic model. Formally, in binary logistic regression there is a single binary dependent variable, coded by an indicator variable, where the two values are labeled "0" and "1", while the independent variables can each be a binary variable or a continuous variable. The corresponding probability of the value labeled "1" can vary between 0 and 1, hence the labeling; the function that converts log-odds to probability is the logistic function, hence the name. The unit of measurement for the log-odds scale is called a logit, from logistic unit, hence the alternative names. See § Background and § Definition for formal mathematics, and § Example for a worked example.
In mathematics, a quadratic form is a polynomial with terms all of degree two. For example,
In mathematics, a quadratic irrational number is an irrational number that is the solution to some quadratic equation with rational coefficients which is irreducible over the rational numbers. Since fractions in the coefficients of a quadratic equation can be cleared by multiplying both sides by their least common denominator, a quadratic irrational is an irrational root of some quadratic equation with integer coefficients. The quadratic irrational numbers, a subset of the complex numbers, are algebraic numbers of degree 2, and can therefore be expressed as

The square root of 2 is a positive real number that, when multiplied by itself, equals the number 2. It may be written in mathematics as or , and is an algebraic number. Technically, it should be called the principal square root of 2, to distinguish it from the negative number with the same property.
An odds ratio (OR) is a statistic that quantifies the strength of the association between two events, A and B. The odds ratio is defined as the ratio of the odds of A in the presence of B and the odds of A in the absence of B, or equivalently, the ratio of the odds of B in the presence of A and the odds of B in the absence of A. Two events are independent if and only if the OR equals 1, i.e., the odds of one event are the same in either the presence or absence of the other event. If the OR is greater than 1, then A and B are associated (correlated) in the sense that, compared to the absence of B, the presence of B raises the odds of A, and symmetrically the presence of A raises the odds of B. Conversely, if the OR is less than 1, then A and B are negatively correlated, and the presence of one event reduces the odds of the other event.
In statistics, an effect size is a value measuring the strength of the relationship between two variables in a population, or a sample-based estimate of that quantity. It can refer to the value of a statistic calculated from a sample of data, the value of a parameter for a hypothetical population, or to the equation that operationalizes how statistics or parameters lead to the effect size value. Examples of effect sizes include the correlation between two variables, the regression coefficient in a regression, the mean difference, or the risk of a particular event happening. Effect sizes complement statistical hypothesis testing, and play an important role in power analyses, sample size planning, and in meta-analyses. The cluster of data-analysis methods concerning effect sizes is referred to as estimation statistics.
In population genetics, linkage disequilibrium (LD) is the non-random association of alleles at different loci in a given population. Loci are said to be in linkage disequilibrium when the frequency of association of their different alleles is higher or lower than what would be expected if the loci were independent and associated randomly.
In statistics, a contingency table is a type of table in a matrix format that displays the (multivariate) frequency distribution of the variables. They are heavily used in survey research, business intelligence, engineering, and scientific research. They provide a basic picture of the interrelation between two variables and can help find interactions between them. The term contingency table was first used by Karl Pearson in "On the Theory of Contingency and Its Relation to Association and Normal Correlation", part of the Drapers' Company Research Memoirs Biometric Series I published in 1904.

In probability theory and statistics, the continuous uniform distribution or rectangular distribution is a family of symmetric probability distributions. The distribution describes an experiment where there is an arbitrary outcome that lies between certain bounds. The bounds are defined by the parameters, a and b, which are the minimum and maximum values. The interval can either be closed or open. Therefore, the distribution is often abbreviated U, where U stands for uniform distribution. The difference between the bounds defines the interval length; all intervals of the same length on the distribution's support are equally probable. It is the maximum entropy probability distribution for a random variable X under no constraint other than that it is contained in the distribution's support.
Methods of computing square roots are numerical analysis algorithms for approximating the principal, or non-negative, square root of a real number. Arithmetically, it means given , a procedure for finding a number which when multiplied by itself, yields ; algebraically, it means a procedure for finding the non-negative root of the equation ; geometrically, it means given two line segments, a procedure for constructing their geometric mean.

An attenuator is an electronic device that reduces the power of a signal without appreciably distorting its waveform.
In statistics, Goodman and Kruskal's gamma is a measure of rank correlation, i.e., the similarity of the orderings of the data when ranked by each of the quantities. It measures the strength of association of the cross tabulated data when both variables are measured at the ordinal level. It makes no adjustment for either table size or ties. Values range from −1 to +1. A value of zero indicates the absence of association.
The square root of 5 is the positive real number that, when multiplied by itself, gives the prime number 5. It is more precisely called the principal square root of 5, to distinguish it from the negative number with the same property. This number appears in the fractional expression for the golden ratio. It can be denoted in surd form as:
In statistics, the phi coefficient is a measure of association for two binary variables. In machine learning, it is known as the Matthews correlation coefficient (MCC) and used as a measure of the quality of binary (two-class) classifications, introduced by biochemist Brian W. Matthews in 1975. Introduced by Karl Pearson, and also known as the Yule phi coefficient from its introduction by Udny Yule in 1912 this measure is similar to the Pearson correlation coefficient in its interpretation. In fact, a Pearson correlation coefficient estimated for two binary variables will return the phi coefficient. Two binary variables are considered positively associated if most of the data falls along the diagonal cells. In contrast, two binary variables are considered negatively associated if most of the data falls off the diagonal. If we have a 2×2 table for two random variables x and y


