Compact letter display

Last updated

Compact Letter Display (CLD) is a statistical method to clarify the output of multiple hypothesis testing when using the ANOVA and Tukey's range tests. CLD can also be applied following the Duncan's new multiple range test (which is similar to Tukey's range test). CLD facilitates the identification of variables, or factors, that have statistically different means (or averages) vs. the ones that do not have statistically different means (or averages).

Contents

The basic technique of compact letter display is to label variables by one or more letters, so that variables are statistically indistinguishable if and only if they share at least one letter. The problem of doing so, using as few distinct letters as possible can be represented combinatorially as the problem of computing an edge clique cover of a graph representing pairs of indistinguishable variables. [1]

As well as marking distinguishability in this way, CLD also ranks variables, or factors, by their respective mean (or average) in descending order. The CLD methodology can be applied to tabular data (spreadsheet, data frame) or visual data (box plot and bar chart).

The basics of CLD

CLD identifies the variables that are statistically different vs. the ones that are not

Each variable that shares a mean that is not statistically different from another one will share the same letter. [2] [3] [4]   For example:

”a” “ab” “b”

The above indicates that the first variable “a” has a mean (or average) that is statistically different from the third one “b”.  But, the second variable “ab” has a mean that is not statistically different from either the first or the third variable. Let's look at another example:

”a” “ab” “bc” “c”

The above indicates that the first variable “a” has a mean (or average) that is statistically different from the third variable “bc” and the fourth one “c”.  But, this first variable “a” is not statistically different from the second one “ab”.

Given the structure of the Roman alphabet, the CLD methodology could readily compare up to 26 different variables, or factors. This constraint is typically much higher than the vast majority of multiple hypothesis testing conducted using ANOVA and Tukey's range tests.

CLD ranks the variables in descending mean (or average) order

So, the variable with the highest mean (or average) will be named “a” (if it is statistically different from all the others, otherwise it may be called "ab", etc.).  And, the variable with the lowest mean (or average) will have the highest letter among the tested variables. [2] [3] [4]

A CLD example

We are going to test if the average rainfall in five West Coast cities is statistically different.  These cities are:

  1. Eugene (OR)
  2. Portland (OR)
  3. San Francisco (CA)
  4. Seattle (WA)
  5. Spokane (WA)

The data is annual rainfall inches (1951 – 2021).

The data source is the NOAA.

First, we will improve the tabular data using CLD.

Next, we will improve the visual data using CLD.

Improving tabular data with CLD

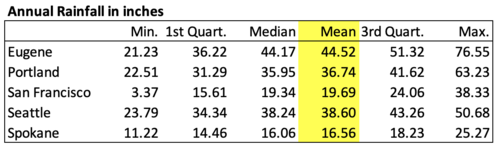
Here are the five West Coast cities rainfall data before applying CLD methodology.

Rainfall data for five West Coast cities Rainfall data for five West Coast Cities.png
Rainfall data for five West Coast cities

As shown above, the rainfall data for the five West Coast cities is sorted in alphabetical order. This order is not informative. It is challenging to figure out which cities' respective mean or average are different from each other.

Next, we reproduce the same table but we sort the cities using the CLD methodology after we would have conducted a Tukey's range test.

Rainfall data for five West Coast cities using CLD methodology CLD Table.png
Rainfall data for five West Coast cities using CLD methodology

The above table using the CLD methodology is far more informative. It has ranked the cities by their respective mean or average rainfall in descending order. And, it has also grouped the cities that have similar mean-rainfall (not statistically different using an alpha value of 0.05).

As shown, Seattle and Portland have mean rainfall levels that are not statistically different from each other. They are both classified "b". Also, San Francisco and Spokane have mean rainfall levels that are not statistically different from each other. They are both classified "c." But, Eugene's mean rainfall level is statistically different and higher than either Seattle & Portland or San Francisco & Spokane. And, Seattle & Portland have mean rainfall levels that are statistically different and higher than San Francisco & Spokane.

Improving visual data with CLD

Here is a first box plot with cities just sorted in alphabetical order from left to right.

Box plot of five West Coast cities rainfall data Boxplot of five West Coast cities rainfall data.png
Box plot of five West Coast cities rainfall data

The box plot above is not entirely clear. It is hard to distinguish the cities that are somewhat similar (average or mean is not statistically different) vs. the ones that are dissimilar (average or mean is statistically different). Now, let's view the same boxplot using the CLD methodology.

Box plot of five West Coast cities rainfall data using the CLD methodology CLD Boxplot.png
Box plot of five West Coast cities rainfall data using the CLD methodology

The box plot above, using the CLD methodology, is now far more informative. The cities are sorted in descending order from left to right. The color density is tiered with the cities having higher rainfall being colored with more dense or opaque tones; meanwhile, the cities with lower rainfall have less dense or more transparent tones. Additionally, we can readily identify the cities that have similar rainfall means (not statistically different) such as Seattle & Portland hat are both identified with the "b" letter. Additionally, San Francisco & Spokane also have similar rainfall means as they are both identified with the "c" letter. On the other hand, Eugene has the highest mean rainfall level of them all; and, it is statistically different (higher) than all other cities as it is the only city identified with the letter "a".

The benefits of CLD

In the absence of the CLD methodology, the main underlying way of identifying statistical difference in means between paired variables is the mentioned Tukey's range test. The latter is a very informative test catered to an audience of statisticians. Outside of such a specialized audience, the test output as shown below is rather challenging to interpret.

Tukey's Range Test results for five West Coast cities rainfall data Tukey's range test results for five West Coast cities.png
Tukey's Range Test results for five West Coast cities rainfall data

The Tukey's range test uncovered that San Francisco & Spokane did not have statistically different rainfall mean (at the alpha = 0.05 level) with a p-value of 0.08. Seattle & Portland also did not have statistically different rainfall mean, with a difference associated with a p-value of 0.54.

As shown earlier, it is a lot easier to convey the differentiation between cities rainfall mean using the CLD methodology. And, the CLD enhanced information can be readily interpreted by a far wider audience than doing otherwise (communicating the results without using the CLD methodology, including communicating the result of the Tukey's range test directly).

How to construct a boxplot in R with Compact Letter Display

Related Research Articles

Analysis of variance (ANOVA) is a collection of statistical models and their associated estimation procedures used to analyze the differences among means. ANOVA was developed by the statistician Ronald Fisher. ANOVA is based on the law of total variance, where the observed variance in a particular variable is partitioned into components attributable to different sources of variation. In its simplest form, ANOVA provides a statistical test of whether two or more population means are equal, and therefore generalizes the t-test beyond two means. In other words, the ANOVA is used to test the difference between two or more means.

<span class="mw-page-title-main">Statistics</span> Study of the collection, analysis, interpretation, and presentation of data

Statistics is the discipline that concerns the collection, organization, analysis, interpretation, and presentation of data. In applying statistics to a scientific, industrial, or social problem, it is conventional to begin with a statistical population or a statistical model to be studied. Populations can be diverse groups of people or objects such as "all people living in a country" or "every atom composing a crystal". Statistics deals with every aspect of data, including the planning of data collection in terms of the design of surveys and experiments.

<i>F</i>-test Statistical hypothesis test, mostly using multiple restrictions

An F-test is any statistical test used to compare the variances of two samples or the ratio of variances between multiple samples. The test statistic, random variable F, is used to determine if the tested data has an F-distribution under the true null hypothesis, and true customary assumptions about the error term (ε). It is most often used when comparing statistical models that have been fitted to a data set, in order to identify the model that best fits the population from which the data were sampled. Exact "F-tests" mainly arise when the models have been fitted to the data using least squares. The name was coined by George W. Snedecor, in honour of Ronald Fisher. Fisher initially developed the statistic as the variance ratio in the 1920s.

<span class="mw-page-title-main">John Tukey</span> American mathematician

John Wilder Tukey was an American mathematician and statistician, best known for the development of the fast Fourier Transform (FFT) algorithm and box plot. The Tukey range test, the Tukey lambda distribution, the Tukey test of additivity, and the Teichmüller–Tukey lemma all bear his name. He is also credited with coining the term bit and the first published use of the word software.

<span class="mw-page-title-main">Exploratory data analysis</span> Approach of analyzing data sets in statistics

In statistics, exploratory data analysis (EDA) is an approach of analyzing data sets to summarize their main characteristics, often using statistical graphics and other data visualization methods. A statistical model can be used or not, but primarily EDA is for seeing what the data can tell us beyond the formal modeling and thereby contrasts traditional hypothesis testing. Exploratory data analysis has been promoted by John Tukey since 1970 to encourage statisticians to explore the data, and possibly formulate hypotheses that could lead to new data collection and experiments. EDA is different from initial data analysis (IDA), which focuses more narrowly on checking assumptions required for model fitting and hypothesis testing, and handling missing values and making transformations of variables as needed. EDA encompasses IDA.

Level of measurement or scale of measure is a classification that describes the nature of information within the values assigned to variables. Psychologist Stanley Smith Stevens developed the best-known classification with four levels, or scales, of measurement: nominal, ordinal, interval, and ratio. This framework of distinguishing levels of measurement originated in psychology and has since had a complex history, being adopted and extended in some disciplines and by some scholars, and criticized or rejected by others. Other classifications include those by Mosteller and Tukey, and by Chrisman.

In statistics, a categorical variable is a variable that can take on one of a limited, and usually fixed, number of possible values, assigning each individual or other unit of observation to a particular group or nominal category on the basis of some qualitative property. In computer science and some branches of mathematics, categorical variables are referred to as enumerations or enumerated types. Commonly, each of the possible values of a categorical variable is referred to as a level. The probability distribution associated with a random categorical variable is called a categorical distribution.

This glossary of statistics and probability is a list of definitions of terms and concepts used in the mathematical sciences of statistics and probability, their sub-disciplines, and related fields. For additional related terms, see Glossary of mathematics and Glossary of experimental design.

In statistics, Duncan's new multiple range test (MRT) is a multiple comparison procedure developed by David B. Duncan in 1955. Duncan's MRT belongs to the general class of multiple comparison procedures that use the studentized range statistic qr to compare sets of means.

In statistics, resampling is the creation of new samples based on one observed sample. Resampling methods are:

  1. Permutation tests
  2. Bootstrapping
  3. Cross validation

In statistics, family-wise error rate (FWER) is the probability of making one or more false discoveries, or type I errors when performing multiple hypotheses tests.

Omnibus tests are a kind of statistical test. They test whether the explained variance in a set of data is significantly greater than the unexplained variance, overall. One example is the F-test in the analysis of variance. There can be legitimate significant effects within a model even if the omnibus test is not significant. For instance, in a model with two independent variables, if only one variable exerts a significant effect on the dependent variable and the other does not, then the omnibus test may be non-significant. This fact does not affect the conclusions that may be drawn from the one significant variable. In order to test effects within an omnibus test, researchers often use contrasts.

<span class="mw-page-title-main">Radar chart</span> Type of chart

A radar chart is a graphical method of displaying multivariate data in the form of a two-dimensional chart of three or more quantitative variables represented on axes starting from the same point. The relative position and angle of the axes is typically uninformative, but various heuristics, such as algorithms that plot data as the maximal total area, can be applied to sort the variables (axes) into relative positions that reveal distinct correlations, trade-offs, and a multitude of other comparative measures.

Tukey's range test, also known as Tukey's test, Tukey method, Tukey's honest significance test, or Tukey's HSDtest, is a single-step multiple comparison procedure and statistical test. It can be used to find means that are significantly different from each other.

In statistics, Scheffé's method, named after American statistician Henry Scheffé, is a method for adjusting significance levels in a linear regression analysis to account for multiple comparisons. It is particularly useful in analysis of variance, and in constructing simultaneous confidence bands for regressions involving basis functions.

<span class="mw-page-title-main">Violin plot</span> Method of plotting numeric data

A violin plot is a statistical graphic for comparing probability distributions. It is similar to a box plot, with the addition of a rotated kernel density plot on each side.

<span class="mw-page-title-main">Plot (graphics)</span> Graphical technique for data sets

A plot is a graphical technique for representing a data set, usually as a graph showing the relationship between two or more variables. The plot can be drawn by hand or by a computer. In the past, sometimes mechanical or electronic plotters were used. Graphs are a visual representation of the relationship between variables, which are very useful for humans who can then quickly derive an understanding which may not have come from lists of values. Given a scale or ruler, graphs can also be used to read off the value of an unknown variable plotted as a function of a known one, but this can also be done with data presented in tabular form. Graphs of functions are used in mathematics, sciences, engineering, technology, finance, and other areas.

The Newman–Keuls or Student–Newman–Keuls (SNK)method is a stepwise multiple comparisons procedure used to identify sample means that are significantly different from each other. It was named after Student (1927), D. Newman, and M. Keuls. This procedure is often used as a post-hoc test whenever a significant difference between three or more sample means has been revealed by an analysis of variance (ANOVA). The Newman–Keuls method is similar to Tukey's range test as both procedures use studentized range statistics. Unlike Tukey's range test, the Newman–Keuls method uses different critical values for different pairs of mean comparisons. Thus, the procedure is more likely to reveal significant differences between group means and to commit type I errors by incorrectly rejecting a null hypothesis when it is true. In other words, the Neuman-Keuls procedure is more powerful but less conservative than Tukey's range test.

In statistics, Tukey's test of additivity, named for John Tukey, is an approach used in two-way ANOVA to assess whether the factor variables are additively related to the expected value of the response variable. It can be applied when there are no replicated values in the data set, a situation in which it is impossible to directly estimate a fully general non-additive regression structure and still have information left to estimate the error variance. The test statistic proposed by Tukey has one degree of freedom under the null hypothesis, hence this is often called "Tukey's one-degree-of-freedom test."

References

  1. Gramm, Jens; Guo, Jiong; Hüffner, Falk; Niedermeier, Rolf; Piepho, Hans-Peter; Schmid, Ramona (2008). "Algorithms for compact letter displays: Comparison and evaluation". Computational Statistics & Data Analysis. 52 (2): 725–736. doi:10.1016/j.csda.2006.09.035. MR   2418523.
  2. 1 2 "Compact Letter Display (CLD)". schmidtpaul.github.io. Retrieved 2022-09-04.
  3. 1 2 Piepho, Hans-Peter (2004-06-01). "An Algorithm for a Letter-Based Representation of All-Pairwise Comparisons". Journal of Computational and Graphical Statistics. 13 (2): 456–466. doi:10.1198/1061860043515. ISSN   1061-8600. S2CID   122068627.
  4. 1 2 Piepho, Hans-Peter (March 2018). "Letters in Mean Comparisons: What They Do and Don't Mean". Researchgate.com. Retrieved September 3, 2022.
  5. "Compact Letter Displays". John Quensen's blog. 2020-01-15. Retrieved 2022-09-04.
  6. "cld: Set up a compact letter display of all pair-wise comparisons in multcomp: Simultaneous Inference in General Parametric Models". rdrr.io. Retrieved 2022-09-04.

Further reading