
Hail is a form of solid precipitation. It is distinct from ice pellets, though the two are often confused. It consists of balls or irregular lumps of ice, each of which is called a hailstone. Ice pellets generally fall in cold weather, while hail growth is greatly inhibited during low surface temperatures.

A supercell is a thunderstorm characterized by the presence of a mesocyclone, a deep, persistently rotating updraft. Due to this, these storms are sometimes referred to as rotating thunderstorms. Of the four classifications of thunderstorms, supercells are the overall least common and have the potential to be the most severe. Supercells are often isolated from other thunderstorms, and can dominate the local weather up to 32 kilometres (20 mi) away. They tend to last 2–4 hours.
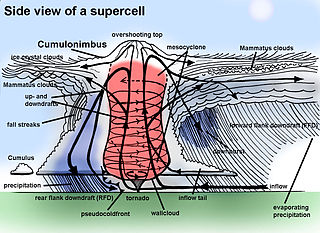
A mesocyclone is a meso-gamma mesoscale region of rotation (vortex), typically around 2 to 6 mi in diameter, most often noticed on radar within thunderstorms. In the northern hemisphere it is usually located in the right rear flank of a supercell, or often on the eastern, or leading, flank of a high-precipitation variety of supercell. The area overlaid by a mesocyclone’s circulation may be several miles (km) wide, but substantially larger than any tornado that may develop within it, and it is within mesocyclones that intense tornadoes form.

NEXRAD or Nexrad is a network of 159 high-resolution S-band Doppler weather radars operated by the National Weather Service (NWS), an agency of the National Oceanic and Atmospheric Administration (NOAA) within the United States Department of Commerce, the Federal Aviation Administration (FAA) within the Department of Transportation, and the U.S. Air Force within the Department of Defense. Its technical name is WSR-88D.
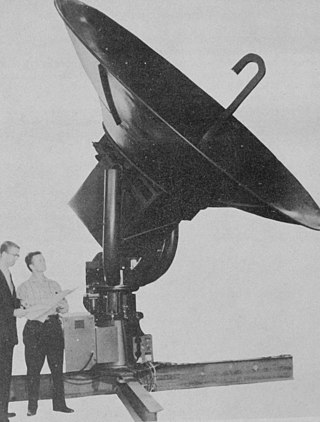
WSR-57 radars were the primary weather surveillance radar used by the United States for over 35 years. The National Weather Service operated a network of this model radar across the country, watching for severe weather.

Weather radar, also called weather surveillance radar (WSR) and Doppler weather radar, is a type of radar used to locate precipitation, calculate its motion, and estimate its type. Modern weather radars are mostly pulse-Doppler radars, capable of detecting the motion of rain droplets in addition to the intensity of the precipitation. Both types of data can be analyzed to determine the structure of storms and their potential to cause severe weather.
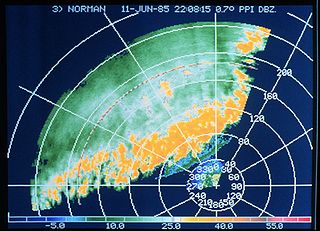
A plan position indicator (PPI) is a type of radar display that represents the radar antenna in the center of the display, with the distance from it and height above ground drawn as concentric circles. As the radar antenna rotates, a radial trace on the PPI sweeps in unison with it about the center point. It is the most common type of radar display.
The National Severe Storms Laboratory (NSSL) is a National Oceanic and Atmospheric Administration (NOAA) weather research laboratory under the Office of Oceanic and Atmospheric Research. It is one of seven NOAA Research Laboratories (RLs).
Decibel relative to Z, or dBZ, is a logarithmic dimensionless technical unit used in radar, mostly in weather radar, to compare the equivalent reflectivity factor (Z) of a remote object to the return of a droplet of rain with a diameter of 1 mm. It is proportional to the number of drops per unit volume and the sixth power of drops' diameter and is thus used to estimate the rain or snow intensity. With other variables analyzed from the radar returns it helps to determine the type of precipitation. Both the radar reflectivity factor and its logarithmic version are commonly referred to as reflectivity when the context is clear. In short, the higher the dBZ value, the more likely it is for severe weather to occur in the form of precipitation.
The constant altitude plan position indicator, better known as CAPPI, is a radar display which gives a horizontal cross-section of data at constant altitude. It has been developed by McGill University in Montreal by the Stormy Weather Group to circumvent some problems with the PPI:

A wind profiler is a type of weather observing equipment that uses radar or sound waves (SODAR) to detect the wind speed and direction at various elevations above the ground. Readings are made at each kilometer above sea level, up to the extent of the troposphere. Above this level there is inadequate water vapor present to produce a radar "bounce." The data synthesized from wind direction and speed is very useful to meteorological forecasting and timely reporting for flight planning. A twelve-hour history of data is available through NOAA websites.

The bounded weak echo region, also known as a BWER or a vault, is a radar signature within a thunderstorm characterized by a local minimum in radar reflectivity at low levels which extends upward into, and is surrounded by higher reflectivities aloft, forming a kind of dome of weak echoes. This feature is associated with a strong updraft and is almost always found in the inflow region of a thunderstorm: it cannot be seen visually. The BWER has been noted on radar imagery of severe thunderstorms since 1973 and has a lightning detection system equivalent known as a lightning hole.
Volumetric Imaging and Processing of Integrated Radar, known by the acronym VIPIR, is an analysis and display program for Doppler weather radar, created and sold by Baron Services. This software allows improved analysis of radar data for private users, in particular television stations, similar to the Weather Decision Support System program used by the National Weather Service.

Atmospheric convection is the result of a parcel-environment instability in the atmosphere. Different lapse rates within dry and moist air masses lead to instability. Mixing of air during the day expands the height of the planetary boundary layer, leading to increased winds, cumulus cloud development, and decreased surface dew points. Convection involving moist air masses leads to thunderstorm development, which is often responsible for severe weather throughout the world. Special threats from thunderstorms include hail, downbursts, and tornadoes.
Convective storm detection is the meteorological observation, and short-term prediction, of deep moist convection (DMC). DMC describes atmospheric conditions producing single or clusters of large vertical extension clouds ranging from cumulus congestus to cumulonimbus, the latter producing thunderstorms associated with lightning and thunder. Those two types of clouds can produce severe weather at the surface and aloft.

Vertically integrated liquid (VIL) is an estimate of the total mass of precipitation in the clouds. The measurement is obtained by observing the reflectivity of the air which is obtained with weather radar.

GRLevelX is a suite of data processing and display programs developed by Gibson Ridge Software, LLC (GRS), to view weather radar data. It went on the market in March 2005. It comes in three versions, all of which ingest raw data: GRLevel2 and GRLevel2 Analyst Edition for viewing Level II data of the National Weather Service (NWS), and GRLevel3 for viewing Level III data. All programs are capable of rendering dual polarization data.
Terminal Doppler Weather Radar (TDWR) is a Doppler weather radar system with a three-dimensional "pencil beam" used primarily for the detection of hazardous wind shear conditions, precipitation, and winds aloft on and near major airports situated in climates with great exposure to thunderstorms in the United States. As of 2011, all were in-service with 45 operational radars, some covering multiple airports in major metropolitan locations, across the United States & Puerto Rico. Several similar weather radars have also been sold to other countries such as China (Hong Kong). Funded by the United States Federal Aviation Administration (FAA), TDWR technology was developed in the early 1990s at Lincoln Laboratory, part of the Massachusetts Institute of Technology, to assist air traffic controllers by providing real-time wind shear detection and high-resolution precipitation data.

This glossary of meteorology is a list of terms and concepts relevant to meteorology and atmospheric science, their sub-disciplines, and related fields.

The Joint Polarization Experiment (JPOLE) was a test for evaluating the performance of the WSR-88D in order to modify it to include dual polarization. This program was a joint project of the National Weather Service (NWS), the Federal Aviation Administration (FAA), and the US Air Force Meteorological Agency (AFWA), which took place from 2000-2004. It has resulted in the upgrading of the entire meteorological radar network in the United States by adding dual polarization to better determine the type of hydrometeor, and quantities that have fallen.

