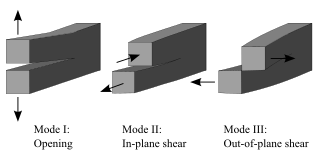
Fracture is the appearance of a crack or complete separation of an object or material into two or more pieces under the action of stress. The fracture of a solid usually occurs due to the development of certain displacement discontinuity surfaces within the solid. If a displacement develops perpendicular to the surface, it is called a normal tensile crack or simply a crack; if a displacement develops tangentially, it is called a shear crack, slip band, or dislocation.

In materials science, fatigue is the initiation and propagation of cracks in a material due to cyclic loading. Once a fatigue crack has initiated, it grows a small amount with each loading cycle, typically producing striations on some parts of the fracture surface. The crack will continue to grow until it reaches a critical size, which occurs when the stress intensity factor of the crack exceeds the fracture toughness of the material, producing rapid propagation and typically complete fracture of the structure.

Fracture mechanics is the field of mechanics concerned with the study of the propagation of cracks in materials. It uses methods of analytical solid mechanics to calculate the driving force on a crack and those of experimental solid mechanics to characterize the material's resistance to fracture.

Crazing is a yielding mechanism in polymers characterized by the formation of a fine network of microvoids and fibrils. These structures typically appear as linear features and frequently precede brittle fracture. The fundamental difference between crazes and cracks is that crazes contain polymer fibrils, constituting about 50% of their volume, whereas cracks do not. Unlike cracks, crazes can transmit load between their two faces through these fibrils.

Delamination is a mode of failure where a material fractures into layers. A variety of materials, including laminate composites and concrete, can fail by delamination. Processing can create layers in materials, such as steel formed by rolling and plastics and metals from 3D printing which can fail from layer separation. Also, surface coatings, such as paints and films, can delaminate from the coated substrate.

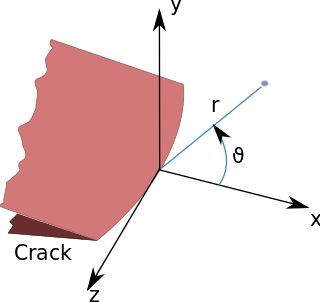
In fracture mechanics, the stress intensity factor is used to predict the stress state near the tip of a crack or notch caused by a remote load or residual stresses. It is a theoretical construct usually applied to a homogeneous, linear elastic material and is useful for providing a failure criterion for brittle materials, and is a critical technique in the discipline of damage tolerance. The concept can also be applied to materials that exhibit small-scale yielding at a crack tip.

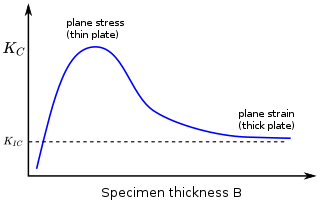
In materials science, fracture toughness is the critical stress intensity factor of a sharp crack where propagation of the crack suddenly becomes rapid and unlimited. A component's thickness affects the constraint conditions at the tip of a crack with thin components having plane stress conditions and thick components having plane strain conditions. Plane strain conditions give the lowest fracture toughness value which is a material property. The critical value of stress intensity factor in mode I loading measured under plane strain conditions is known as the plane strain fracture toughness, denoted . When a test fails to meet the thickness and other test requirements that are in place to ensure plane strain conditions, the fracture toughness value produced is given the designation . Fracture toughness is a quantitative way of expressing a material's resistance to crack propagation and standard values for a given material are generally available.
Corrosion fatigue is fatigue in a corrosive environment. It is the mechanical degradation of a material under the joint action of corrosion and cyclic loading. Nearly all engineering structures experience some form of alternating stress, and are exposed to harmful environments during their service life. The environment plays a significant role in the fatigue of high-strength structural materials like steel, aluminum alloys and titanium alloys. Materials with high specific strength are being developed to meet the requirements of advancing technology. However, their usefulness depends to a large extent on the degree to which they resist corrosion fatigue.
The J-integral represents a way to calculate the strain energy release rate, or work (energy) per unit fracture surface area, in a material. The theoretical concept of J-integral was developed in 1967 by G. P. Cherepanov and independently in 1968 by James R. Rice, who showed that an energetic contour path integral was independent of the path around a crack.

Paris' law is a crack growth equation that gives the rate of growth of a fatigue crack. The stress intensity factor characterises the load around a crack tip and the rate of crack growth is experimentally shown to be a function of the range of stress intensity seen in a loading cycle. The Paris equation is

A fracture is any separation in a geologic formation, such as a joint or a fault that divides the rock into two or more pieces. A fracture will sometimes form a deep fissure or crevice in the rock. Fractures are commonly caused by stress exceeding the rock strength, causing the rock to lose cohesion along its weakest plane. Fractures can provide permeability for fluid movement, such as water or hydrocarbons. Highly fractured rocks can make good aquifers or hydrocarbon reservoirs, since they may possess both significant permeability and fracture porosity.
In fracture mechanics, the energy release rate, , is the rate at which energy is transformed as a material undergoes fracture. Mathematically, the energy release rate is expressed as the decrease in total potential energy per increase in fracture surface area, and is thus expressed in terms of energy per unit area. Various energy balances can be constructed relating the energy released during fracture to the energy of the resulting new surface, as well as other dissipative processes such as plasticity and heat generation. The energy release rate is central to the field of fracture mechanics when solving problems and estimating material properties related to fracture and fatigue.
Polymer fracture is the study of the fracture surface of an already failed material to determine the method of crack formation and extension in polymers both fiber reinforced and otherwise. Failure in polymer components can occur at relatively low stress levels, far below the tensile strength because of four major reasons: long term stress or creep rupture, cyclic stresses or fatigue, the presence of structural flaws and stress-cracking agents. Formations of submicroscopic cracks in polymers under load have been studied by x ray scattering techniques and the main regularities of crack formation under different loading conditions have been analyzed. The low strength of polymers compared to theoretically predicted values are mainly due to the many microscopic imperfections found in the material. These defects namely dislocations, crystalline boundaries, amorphous interlayers and block structure can all lead to the non-uniform distribution of mechanical stress.

The cohesive zone model (CZM) is a model in fracture mechanics where fracture formation is regarded as a gradual phenomenon and separation of the crack surfaces takes place across an extended crack tip, or cohesive zone, and is resisted by cohesive tractions. The origin of this model can be traced back to the early sixties by Dugdale (1960) and Barenblatt (1962) to represent nonlinear processes located at the front of a pre-existent crack.
Crack closure is a phenomenon in fatigue loading, where the opposing faces of a crack remain in contact even with an external load acting on the material. As the load is increased, a critical value will be reached at which time the crack becomes open. Crack closure occurs from the presence of material propping open the crack faces and can arise from many sources including plastic deformation or phase transformation during crack propagation, corrosion of crack surfaces, presence of fluids in the crack, or roughness at cracked surfaces.

Crack tip opening displacement (CTOD) or is the distance between the opposite faces of a crack tip at the 90° intercept position. The position behind the crack tip at which the distance is measured is arbitrary but commonly used is the point where two 45° lines, starting at the crack tip, intersect the crack faces. The parameter is used in fracture mechanics to characterize the loading on a crack and can be related to other crack tip loading parameters such as the stress intensity factor and the elastic-plastic J-integral.
In materials science, toughening refers to the process of making a material more resistant to the propagation of cracks. When a crack propagates, the associated irreversible work in different materials classes is different. Thus, the most effective toughening mechanisms differ among different materials classes. The crack tip plasticity is important in toughening of metals and long-chain polymers. Ceramics have limited crack tip plasticity and primarily rely on different toughening mechanisms.
Fracture of biological materials may occur in biological tissues making up the musculoskeletal system, commonly called orthopedic tissues: bone, cartilage, ligaments, and tendons. Bone and cartilage, as load-bearing biological materials, are of interest to both a medical and academic setting for their propensity to fracture. For example, a large health concern is in preventing bone fractures in an aging population, especially since fracture risk increases ten fold with aging. Cartilage damage and fracture can contribute to osteoarthritis, a joint disease that results in joint stiffness and reduced range of motion.

A crack growth equation is used for calculating the size of a fatigue crack growing from cyclic loads. The growth of a fatigue crack can result in catastrophic failure, particularly in the case of aircraft. When many growing fatigue cracks interact with one another it is known as widespread fatigue damage. A crack growth equation can be used to ensure safety, both in the design phase and during operation, by predicting the size of cracks. In critical structure, loads can be recorded and used to predict the size of cracks to ensure maintenance or retirement occurs prior to any of the cracks failing. Safety factors are used to reduce the predicted fatigue life to a service fatigue life because of the sensitivity of the fatigue life to the size and shape of crack initiating defects and the variability between assumed loading and actual loading experienced by a component.

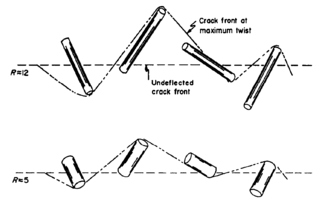
The Faber–Evans model for crack deflection, is a fracture mechanics-based approach to predict the increase in toughness in two-phase ceramic materials due to crack deflection. The effect is named after Katherine Faber and her mentor, Anthony G. Evans, who introduced the model in 1983. The Faber–Evans model is a principal strategy for tempering brittleness and creating effective ductility.


