Critical path drag is a project management metric[1] developed by Stephen Devaux as part of the Total Project Control (TPC) approach to schedule analysis and compression [2] in the critical path method of scheduling. Critical path drag is the amount of time that an activity or constraint on the critical path is adding to the project duration. Alternatively, it is the maximum amount of time that one can shorten the activity before it is no longer on the critical path or before its duration becomes zero.
In networks where all dependencies are finish-to-start (FS) relationships (i.e., where a predecessor must finish before a successor starts), the drag of a critical path activity is equal to whichever is less: its remaining duration or (if there is one or more parallel activity) the total float of the parallel activity that has the least total float.[3]
Activity-on-node diagram showing critical path schedule, along with total float and critical path drag computations
In this diagram, Activities A, B, C, D, and E comprise the critical path, while Activities F, G, and H are off the critical path with floats of 15 days, 5 days, and 20 days respectively. Whereas activities that are off the critical path have float and are therefore not delaying completion of the project, those on the critical path have critical path drag, i.e., they delay project completion.
Activities A and E have nothing in parallel and therefore have drags of 10 days and 20 days respectively.
Activities B and C are both parallel to F (float of 15) and H (float of 20). B has a duration of 20 and drag of 15 (equal to F's float), while C has a duration of only 5 days and thus drag of only 5.
Activity D, with a duration of 10 days, is parallel to G (float of 5) and H (float of 20) and therefore its drag is equal to 5, the float of G.
In network schedules that include start-to-start (SS), finish-to-finish (FF) and start-to-finish (SF) relationships and lags, drag computation can be quite complex, often requiring either the decomposition of critical path activities into their components so as to create all relationships as finish-to-start, or the use of scheduling software that computes critical path drag with complex dependencies.
A quick way to compute the drag of a critical path activity that has one or more start-to-start or start-to-start plus lag successors is that the drag of the critical path activity that has such successors will be equal to whichever is less: the duration of the predecessor activity OR the sum of the lag plus total float of whichever SS successor has the LEAST lag plus total float. This is shown in the diagram where Activity A has four SS+lag successors: B, C, E, and F. The drag-plus-lag of B is 3 + 12 = 15. For each of C, E, and F, it is 20, 12, and 10 respectively. The lowest is F with 10. Since Activity A's duration is 20 which is higher than F's drag-plus-lag of 10, A's drag is 10. In other words, A is adding 10 units of time to the project duration. (If there were another separate parallel path, not in this diagram, that had float of 9 or fewer units, then A's drag would be equal to that float amount as it would be less than 10.)
Activity-on-node diagram showing critical path drag computation for an activity with start-to-start successors
Note that in the SS + lag relationship, the drag is in the work scheduled in the predecessor activity, e.g., digging the first 100 metres of trench in order to start laying the pipe. If the volume of work in the first part of the activity can be performed faster, the lag to the trench-digging can shrink, decreasing the drag in the predecessor and compressing the critical path. Occasionally, however, the lag on an SS relationship may be strictly a "time lag" representing a waiting period rather than work in the predecessor. In that case, the drag should be associated with the lag as that constraint is the delaying factor that must be addressed to shorten the project. Time lags are far more common on finish-to-start and finish-to-finish relationships ("Wait for cement to dry") than on SS relationships.
Critical path drag is often combined with an estimate of the increased cost and/or reduced expected value of the project due to each unit of the critical path's duration. This allows such cost to be attributed to individual critical path activities through their respective drag amounts (i.e., the activity's drag cost). If the cost of each unit of time in the diagram above is $10,000, the drag cost of E would be $200,000, B would be $150,000, A would be $100,000, and C and D $50,000 each.
This in turn can allow a project manager to justify those additional resources that will reduce the drag and drag cost of specific critical path activities where the cost of such resources would be less than the value generated by reduction in drag. For example, if the addition of $50,000 worth of resources would reduce the duration of B to ten days, the project would take only 55 days, B's drag would be reduced to five days, and its drag cost would be reduced to $50,000.
Sources
↑ Devaux, Stephen A. Total Project Control: A Manager's Guide to Integrated Project Planning, Measuring, and Tracking. John Wiley & Sons, pp. 138 - 146, 1999. ISBN0-471-32859-6.
Devaux, Stephen A. (2014). Managing Projects as Investments: Earned Value to Business Value. CRC Press. ISBN978-1482212709.
Devaux, Stephen A. (2015). Total Project Control (2nd Edition): A Practitioner's Guide to Managing Projects as Investments. CRC Press. ISBN978-1498706773.
Earned value management (EVM), earned value project management, or earned value performance management (EVPM) is a project management technique for measuring project performance and progress in an objective manner.
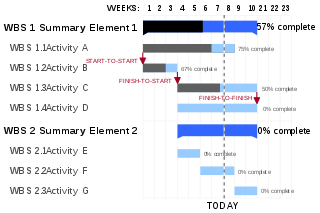
Project planning is part of project management, which relates to the use of schedules such as Gantt charts to plan and subsequently report progress within the project environment. Project planning can be done manually or by the use of project management software.
The critical path method (CPM), or critical path analysis (CPA), is an algorithm for scheduling a set of project activities. A critical path is determined by identifying the longest stretch of dependent activities and measuring the time required to complete them from start to finish. It is commonly used in conjunction with the program evaluation and review technique (PERT).
In a project network, a dependency is a link among a project's terminal elements.
The program evaluation and review technique (PERT) is a statistical tool used in project management, which was designed to analyze and represent the tasks involved in completing a given project.
A Gantt chart is a bar chart that illustrates a project schedule. It was designed and popularized by Henry Gantt around the years 1910–1915. Modern Gantt charts also show the dependency relationships between activities and the current schedule status.
In project management, float or slack is the amount of time that a task in a project network can be delayed without causing a delay to:
A project network diagram is a graph that displays the order in which a project’s activities are to be completed. Derived from the work breakdown structure, the terminal elements of a project are organized sequentially based on the relationship among them. It is typically drawn from left to right to reflect project chronology.
The precedence diagram method (PDM) is a tool for scheduling activities in a project plan. It is a method of constructing a project schedule network diagram that uses boxes, referred to as nodes, to represent activities and connects them with arrows that show the dependencies. It is also called the activity-on-node (AON) method.
In project management, level of effort (LOE) is a support-type project activity that must be done to support other work activities or the entire project effort. It usually consists of short amounts of work that must be repeated periodically. Examples of such an activity may be project budget accounting, customer liaison, or oiling machinery during manufacturing.
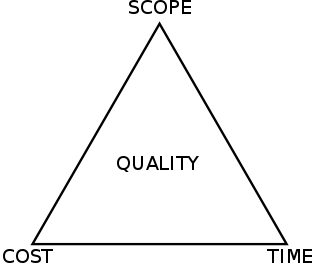
The project management triangle is a model of the constraints of project management. While its origins are unclear, it has been used since at least the 1950s. It contends that:
The quality of work is constrained by the project's budget, deadlines and scope (features).
The project manager can trade between constraints.
Changes in one constraint necessitate changes in others to compensate or quality will suffer.
Arrow diagramming method (ADM) is a network diagramming technique in which activities are represented by arrows. ADM is also known as the activity-on-arrow (AOA) method.
Total project control (TPC) is a project management method that emphasizes continuous tracking and optimization of return on investment (ROI). It was developed by Stephen Devaux. It builds upon earlier techniques such as earned value management, critical path method, and program evaluation and review technique, but uses these to track and index projected project profitability as well as the more traditional cost and schedule. In this way it aims to manage projects as profit and investment centers, rather than cost centers.
The Graphical Path Method (GPM) is a mathematically based algorithm used in project management for planning, scheduling and resource control. GPM represents logical relationships of dated objects – such as activities, milestones, and benchmarks – in a time-scaled network diagram.
A time–distance diagram is generally a diagram with one axis representing time and the other axis distance. Such charts are used in the aviation industry to plot flights, or in scientific research to present effects in respect to distance over time. Transport schedules in graphical form are also called time–distance diagrams, they represent the location of a given vehicle along the transport route.
The following outline is provided as an overview of and topical guide to project management:
Drag cost is a project management metric developed by Stephen Devaux as part of the Total Project Control (TPC) approach to project schedule and cost analysis. It is the amount by which a project's expected return on investment (ROI) is reduced due to the critical path drag of a specific critical path activity Task or other specific schedule factor such as a schedule lag or other delaying constraint.
A value breakdown structure (VBS) is a project management technique introduced by Stephen Devaux as part of the total project control (TPC) approach to project and program value analysis.
Devaux's Index of Project Performance is a project management performance metric formulated by Stephen Devaux as part of the total project control (TPC) approach to project and program value analysis. It is an index that integrates the three variables of a project into a single value-based index where:
This page is based on this Wikipedia article Text is available under the CC BY-SA 4.0 license; additional terms may apply. Images, videos and audio are available under their respective licenses.