In information theory, data compression, source coding, or bit-rate reduction is the process of encoding information using fewer bits than the original representation. Any particular compression is either lossy or lossless. Lossless compression reduces bits by identifying and eliminating statistical redundancy. No information is lost in lossless compression. Lossy compression reduces bits by removing unnecessary or less important information. Typically, a device that performs data compression is referred to as an encoder, and one that performs the reversal of the process (decompression) as a decoder.
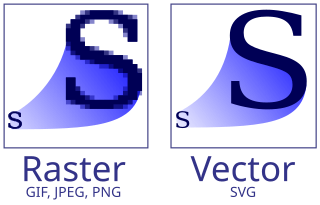
Vector graphics are a form of computer graphics in which visual images are created directly from geometric shapes defined on a Cartesian plane, such as points, lines, curves and polygons. The associated mechanisms may include vector display and printing hardware, vector data models and file formats, as well as the software based on these data models. Vector graphics are an alternative to raster or bitmap graphics, with each having advantages and disadvantages in specific situations.
In telecommunications, data compaction is the reduction of the number of data elements, bandwidth, cost, and time for the generation, transmission, and storage of data without loss of information by eliminating unnecessary redundancy, removing irrelevancy, or using special coding.

In mathematics, the Euclidean distance between two points in Euclidean space is the length of the line segment between them. It can be calculated from the Cartesian coordinates of the points using the Pythagorean theorem, and therefore is occasionally called the Pythagorean distance.

The mel scale is a perceptual scale of pitches judged by listeners to be equal in distance from one another. The reference point between this scale and normal frequency measurement is defined by assigning a perceptual pitch of 1000 mels to a 1000 Hz tone, 40 dB above the listener's threshold. Above about 500 Hz, increasingly large intervals are judged by listeners to produce equal pitch increments.

In mathematics, a time series is a series of data points indexed in time order. Most commonly, a time series is a sequence taken at successive equally spaced points in time. Thus it is a sequence of discrete-time data. Examples of time series are heights of ocean tides, counts of sunspots, and the daily closing value of the Dow Jones Industrial Average.
In mathematics, a piecewise linear or segmented function is a real-valued function of a real variable, whose graph is composed of straight-line segments.
Curve fitting is the process of constructing a curve, or mathematical function, that has the best fit to a series of data points, possibly subject to constraints. Curve fitting can involve either interpolation, where an exact fit to the data is required, or smoothing, in which a "smooth" function is constructed that approximately fits the data. A related topic is regression analysis, which focuses more on questions of statistical inference such as how much uncertainty is present in a curve that is fitted to data observed with random errors. Fitted curves can be used as an aid for data visualization, to infer values of a function where no data are available, and to summarize the relationships among two or more variables. Extrapolation refers to the use of a fitted curve beyond the range of the observed data, and is subject to a degree of uncertainty since it may reflect the method used to construct the curve as much as it reflects the observed data.
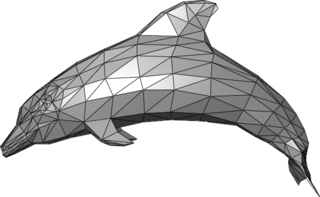
In 3D computer graphics and solid modeling, a polygon mesh is a collection of vertices, edges and faces that defines the shape of a polyhedral object's surface. It simplifies rendering, as in a wire-frame model. The faces usually consist of triangles, quadrilaterals (quads), or other simple convex polygons (n-gons). A polygonal mesh may also be more generally composed of concave polygons, or even polygons with holes.

In statistics, nonlinear regression is a form of regression analysis in which observational data are modeled by a function which is a nonlinear combination of the model parameters and depends on one or more independent variables. The data are fitted by a method of successive approximations (iterations).
Linear predictive analysis is a simple form of first-order extrapolation: if it has been changing at this rate then it will probably continue to change at approximately the same rate, at least in the short term. This is equivalent to fitting a tangent to the graph and extending the line.

In statistics and image processing, to smooth a data set is to create an approximating function that attempts to capture important patterns in the data, while leaving out noise or other fine-scale structures/rapid phenomena. In smoothing, the data points of a signal are modified so individual points higher than the adjacent points are reduced, and points that are lower than the adjacent points are increased leading to a smoother signal. Smoothing may be used in two important ways that can aid in data analysis (1) by being able to extract more information from the data as long as the assumption of smoothing is reasonable and (2) by being able to provide analyses that are both flexible and robust. Many different algorithms are used in smoothing.
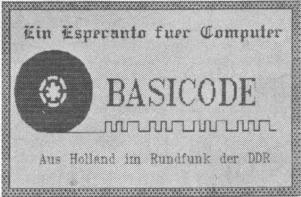
BASICODE was a computer project intended to create a unified standard for the BASIC programming language. BASIC was available on many popular home computers, but there were countless variants that were mostly incompatible with each other. The project was initiated in 1980 by Hobbyscoop, a radio program of the Dutch broadcasting organisation Nederlandse Omroep Stichting (NOS).
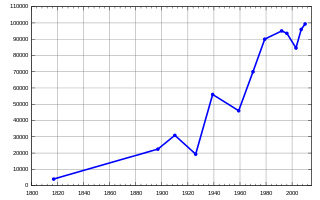
A line chart or line graph, also known as curve chart, is a type of chart that displays information as a series of data points called 'markers' connected by straight line segments. It is a basic type of chart common in many fields. It is similar to a scatter plot except that the measurement points are ordered and joined with straight line segments. A line chart is often used to visualize a trend in data over intervals of time – a time series – thus the line is often drawn chronologically. In these cases they are known as run charts.
Map database management systems are software programs designed to store and recall spatial information for navigation applications, and are thus a form of Geographic information system. They are widely used in localization and navigation, especially in automotive applications. Moreover, they are playing an increasingly important role in the emerging areas of location-based services, active safety functions and advanced driver-assistance systems. Common to these functions is the requirement for an on-board map database that contains information describing the road network.
In geometry, the perpendicular distance between two objects is the distance from one to the other, measured along a line that is perpendicular to one or both.

The FX-601P and FX-602P were programmable calculators, manufactured by Casio from 1981. It was the successor model to the Casio FX-502P series and was itself succeeded in 1990 by the Casio FX-603P.

The NASA Exoplanet Archive is an online astronomical exoplanet catalog and data service that collects and serves public data that support the search for and characterization of extra-solar planets (exoplanets) and their host stars. It is part of the Infrared Processing and Analysis Center and is on the campus of the California Institute of Technology (Caltech) in Pasadena, CA. The archive is funded by NASA and was launched in early December 2011 by the NASA Exoplanet Science Institute as part of NASA's Exoplanet Exploration Program. In June 2019, the archive's collection of confirmed exoplanets surpassed 4,000.
Probability distribution fitting or simply distribution fitting is the fitting of a probability distribution to a series of data concerning the repeated measurement of a variable phenomenon. The aim of distribution fitting is to predict the probability or to forecast the frequency of occurrence of the magnitude of the phenomenon in a certain interval.