Related Research Articles
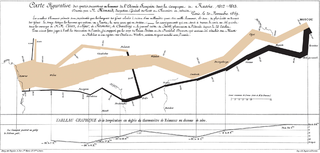
A small multiple is a series of similar graphs or charts using the same scale and axes,allowing them to be easily compared. It uses multiple views to show different partitions of a dataset. The term was popularized by Edward Tufte.

Arthur H. Robinson was an American geographer and cartographer,who was professor in the Geography Department at the University of Wisconsin–Madison from 1947 until he retired in 1980. He was a prolific writer and influential philosopher on cartography,and one of his most notable accomplishments is the Robinson projection of 1961.
Animated mapping is the application of animation,either a computer or video,to add a temporal component to a map displaying change in some dimension. Most commonly the change is shown over time,generally at a greatly changed scale. An example would be the animation produced after the 2004 tsunami showing how the waves spread across the Indian Ocean.
Geovisualization or geovisualisation,also known as cartographic visualization,refers to a set of tools and techniques supporting the analysis of geospatial data through the use of interactive visualization.
In cartography,map coloring is the act of choosing colors as a form of map symbol to be used on a map. In mathematics,map coloring is the act of assigning colors to features of a map such that no two adjacent features have the same color using the minimum number of colors.

A thematic map is a type of map that portrays the geographic pattern of a particular subject matter (theme) in a geographic area. This usually involves the use of map symbols to visualize selected properties of geographic features that are not naturally visible,such as temperature,language,or population. In this,they contrast with general reference maps,which focus on the location of a diverse set of physical features,such as rivers,roads,and buildings. Alternative names have been suggested for this class,such as special-subject or special-purpose maps,statistical maps,or distribution maps,but these have generally fallen out of common usage. Thematic mapping is closely allied with the field of Geovisualization.

Giacomo Gastaldi was an Italian cartographer,astronomer and engineer of the 16th century. Gastaldi began his career as an engineer,serving the Venetian Republic in that capacity until the fourth decade of the sixteenth century. From about 1544 he turned his attention entirely to mapmaking,and his work represents several important turning points in cartographic development.

The International Cartographic Association (ICA),is an organization formed of national member organizations,to provide a forum for issues and techniques in cartography and geographic information science (GIScience). ICA was founded on June 9,1959,in Bern,Switzerland. The first General Assembly was held in Paris in 1961. The mission of the International Cartographic Association is to promote the disciplines and professions of cartography and GIScience in an international context. To achieve these aims,the ICA works with national and international governmental and commercial bodies,and with other international scientific societies.
Critical cartography is a set of mapping practices and methods of analysis grounded in critical theory,specifically the thesis that maps reflect and perpetuate relations of power,typically in favor of a society's dominant group. Critical cartographers aim to reveal the “‘hidden agendas of cartography’as tools of socio-spatial power”. While the term "critical cartography" often refers to a body of theoretical literature,critical cartographers also call for practical applications of critical cartographic theory,such as counter-mapping,participatory mapping,and neogeography.

Jacques Bertin was a French cartographer and theorist,known from his book Sémiologie Graphique,published in 1967. This monumental work,based on his experience as a cartographer and geographer,represents the first and widest intent to provide a theoretical foundation to Information Visualization,with his most lasting contribution being his set of visual variables that can be used to construct map symbols and other graphical techniques one of then being the Bertin Projection,an innovative map projection type.

Geography is a field of science devoted to the study of the lands,features,inhabitants,and phenomena of Earth. The first recorded use of the word γεωγραφίαwas as a title of a book by Greek scholar Eratosthenes. Geography is an all-encompassing discipline that seeks an understanding of Earth and its human and natural complexities—not merely where objects are,but also how they have changed and come to be. While geography is specific to Earth,many concepts can be applied more broadly to other celestial bodies in the field of planetary science. Geography has been called "a bridge between natural science and social science disciplines."
Alan M. MacEachren is an American geographer,Professor of Geography and Director,GeoVISTA Center,Department of Geography,The Pennsylvania State University. He is known for his cross-disciplinary work in the fields of human-centered geographic visualization,scientific and information visualization,and in statistics.

A map symbol or cartographic symbol is a graphical device used to visually represent a real-world feature on a map,working in the same fashion as other forms of symbols. Map symbols may include point markers,lines,regions,continuous fields,or text;these can be designed visually in their shape,size,color,pattern,and other graphic variables to represent a variety of information about each phenomenon being represented.
Counter-mapping is creating maps that challenge "dominant power structures,to further seemingly progressive goals". counter-mapping is used in multiple disciplines to reclaim colonized territory. Counter-maps are prolific in indigenous cultures,"counter-mapping may reify,reinforce,and extend settler boundaries even as it seeks to challenge dominant mapping practices;and still,counter-mapping may simultaneously create conditions of possibility for decolonial ways of repre-senting space and place". The term came into use in the United States when Nancy Peluso used it in 1995 to describe the commissioning of maps by forest users in Kalimantan,Indonesia,to contest government maps of forest areas that undermined indigenous interests. The resultant counter-hegemonic maps strengthen forest users' resource claims. There are numerous expressions closely related to counter-mapping:ethnocartography,alternative cartography,mapping-back,counter-hegemonic mapping,deep mapping and public participatory mapping. Moreover,the terms:critical cartography,subversive cartography,bio-regional mapping,and remapping are sometimes used interchangeably with counter-mapping,but in practice encompass much more.
Cynthia A. Brewer is an American professor of geography at the Pennsylvania State University,Pennsylvania,and author. She has worked as a map and atlas design consultant for the U.S. Census Bureau,National Cancer Institute,National Center for Health Statistics,and National Park Service. She teaches courses in introductory cartography and map design. Her specialism relates to visibility and color theory in cartography. She also works on topographic map design,multi-scale mapping,generalization,and atlas mapping. She has been influential as a theorist for map representations and GIS professionals.
Spatial citizenship describes the ability of individuals and groups to interact and participate in societal spatial decision making through the reflexive production and use of geo-media. Spatial citizens are lay users who are able to use geo-media to question existing perspectives on action in space and to produce,communicate,and negotiate alternative spatial visions.

Emanuela Casti is an Italian geographer and a cartography theorist. Considered an innovator,she has formalized a semiotic theory for the interpretation of maps in their various forms:from historical maps to cybercartography systems. She was full professor from 2001 to 2020 at the University of Bergamo (Italy) and is currently Professor Emeritus. In 2004 Casti founded the Diathesis Cartographic Lab,a permanent laboratory devoted to territorial analysis,cartographic innovation and experimentation and,in 2019,designed and activated the interclass master's degree,in Geourbanistica. Analisi e pianificazione territoriale,urbana,ambientale e valorizzazione del paesaggio at the University of Bergamo
Menno-Jan Kraak is a Dutch cartographer and professor of Geovisual Analytics and Cartography at the Faculty of Geoinformation Sciences and Earth Observation at the University of Twente. He is known for his work in cartography and his activities in the International Cartographic Association.
A visual variable,in cartographic design,graphic design,and data visualization,is an aspect of a graphical object that can visually differentiate it from other objects,and can be controlled during the design process. The concept was first systematized by Jacques Bertin,a French cartographer and graphic designer,and published in his 1967 book,Sémiologie Graphique. Bertin identified a basic set of these variables and provided guidance for their usage;the concept and the set of variables has since been expanded,especially in cartography,where it has become a core principle of education and practice.
George Frederick Jenks (1916-1996) was an American cartographer known for his significant contributions to cartography and geographic information systems(GIS). With a career spanning over three decades,Jenks has played a vital role in advancing map-making technologies,has been instrumental in enhancing the visualization of spatial data,and played foundational roles in developing modern cartographic curricula. The Jenks natural breaks optimization,based on his work,is still widely used in the creation of thematic maps,such as choropleth maps.
References
- ↑ Izaak Walton Killam Memorial Prize
- ↑ Fraser Taylor is awarded the Carl Mannerfelt Gold Medal, International Cartographic Association Retrieved 08 June 2021.
- ↑ "Fraser Taylor Chancellor's Distinguished Research Professor of International Affairs Geography and Environmental Studies". NPSIA. Retrieved 20 June 2021.
- ↑ Fraser Taylor is awarded the Carl Mannerfelt Gold Medal, International Cartographic Association
- ↑ Taylor, D.R. Fraser; Caquard, Sebastien (2006). "Cybercartography: Maps and Mapping in the Information Era". Cartographica . 41 (1): 1–6. doi:10.3138/U631-37K3-3NL6-4136.
- ↑ Taylor, D.R. Fraser; Caquard, Sebastien (2006). "Cybercartography: Maps and Mapping in the Information Era". Cartographica. 41 (1): 1–6. doi:10.3138/U631-37K3-3NL6-4136.
- ↑ MacEachren, Alan; Taylor, D.R.F. (1994). Visualization in Modern Cartography, Volume 2 (1 ed.). Elsevier. pp. 333–343. ISBN 9781483287928 . Retrieved 20 June 2021.
- ↑ Lauriault, Tracey; Craig, Barbara; Pulsifer, Peter; Taylor, D.R. Fraser (2008). "Today's Data Are Part of Tomorrow's Research: Archival Issues in the Sciences". Archivaria. 64 (1): 123–179. Retrieved 20 June 2021.
- ↑ "CS06 - Cybercartographic Atlas of Antarctica". InterPARES 2 Project Case Studies. interpares.org. Retrieved 24 June 2021.
- ↑ Fraser Taylor is awarded the Carl Mannerfelt Gold Medal, International Cartographic Association Retrieved 08 June 2021.
- ↑ Taylor, D. R. Fraser. "Member Directory". Royal Society of Canada. Retrieved 24 June 2021.
- ↑ International Cartographic Association
- ↑ "2014 Canada Council Killam Prize Winners Announced". Killam Laureates. 9 April 2014. Retrieved 20 June 2021.