The boiling point of a substance is the temperature at which the vapor pressure of a liquid equals the pressure surrounding the liquid and the liquid changes into a vapor.

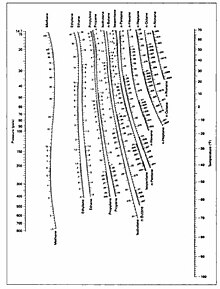
Vapor pressure or equilibrium vapor pressure is defined as the pressure exerted by a vapor in thermodynamic equilibrium with its condensed phases at a given temperature in a closed system. The equilibrium vapor pressure is an indication of a liquid's evaporation rate. It relates to the tendency of particles to escape from the liquid. A substance with a high vapor pressure at normal temperatures is often referred to as volatile. The pressure exhibited by vapor present above a liquid surface is known as vapor pressure. As the temperature of liquid increases, the kinetic energy of its molecules also increases. As the kinetic energy of the molecules increases, the number of molecules transitioning into a vapor also increases, thereby increasing the vapor pressure.
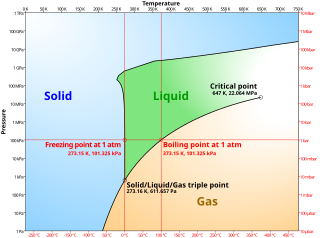
A phase diagram in physical chemistry, engineering, mineralogy, and materials science is a type of chart used to show conditions at which thermodynamically distinct phases occur and coexist at equilibrium.
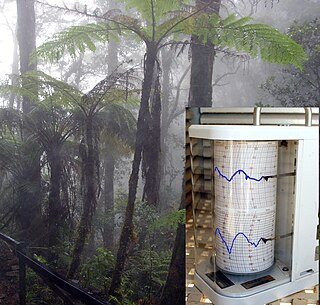
Psychrometrics is the field of engineering concerned with the physical and thermodynamic properties of gas-vapor mixtures.
This page provides supplementary data to the article properties of water.
This page provides supplementary chemical data on carbon dioxide.
This page provides supplementary chemical data on ammonia.
This page provides supplementary chemical data on methane.
A nitrogen rejection unit (NRU) selectively removes nitrogen from a gas. The name can be applied to any system that removes nitrogen from natural gas.
In thermodynamics and chemical engineering, the vapor–liquid equilibrium (VLE) describes the distribution of a chemical species between the vapor phase and a liquid phase.
This page provides supplementary chemical data on benzene.
This page provides supplementary chemical data on carbon tetrachloride.
This page provides supplementary chemical data on cyclohexane.
This page provides supplementary chemical data on 1,2-dichloroethane.
This page provides supplementary chemical data on tetrachloroethylene.
Relative volatility is a measure comparing the vapor pressures of the components in a liquid mixture of chemicals. This quantity is widely used in designing large industrial distillation processes. In effect, it indicates the ease or difficulty of using distillation to separate the more volatile components from the less volatile components in a mixture. By convention, relative volatility is usually denoted as .
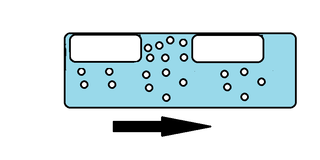
In fluid mechanics, slug flow in liquid–gas two-phase flow is a type of flow pattern. Lighter, faster moving continuous fluid which contains gas bubbles - pushes along a disperse gas bubble. Pressure oscillations within piping can be caused by slug flow. The word slug usually refers to the heavier, slower moving fluid, but can also be used to refer to the bubbles of the lighter fluid.