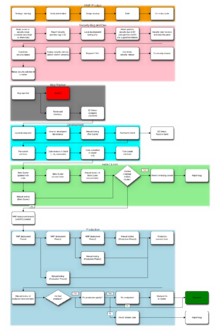
A deployment flowchart (sometimes referred to as a cross functional flowchart) is a business process mapping tool used to articulate the steps and stakeholders of a given process.
A deployment flowchart (sometimes referred to as a cross functional flowchart) is a business process mapping tool used to articulate the steps and stakeholders of a given process.
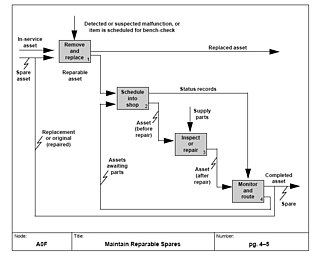
Deployment flowcharts consist of a sequence of activity steps, as well as the interactions between individuals or groups. [1] Each participant in the process is displayed on the map (which is constructed as a matrix) - tasks/activities are then articulated in sequence under the column corresponding to that stakeholder.
As deployment flowcharts highlight the relationships between stakeholders in addition to the process flow [2] they are especially useful in highlighting areas of inefficiency, duplication or unnecessary processing. [3] Often utilized within Six sigma activity, [4] completed flowcharts are commonly used to examine the interfaces between “participants” which are typically causes for delays and other associated issues. Deployment flowcharts are useful for determining who within an organization is required to implement a process and are sometimes used as a business planning tool.
While deployment flowcharts can be drawn by hand using pen and paper, various software tools include functionality to construct the flowcharts on computer. These include products such as Microsoft Visio. [5]
As with other process mapping techniques, deployment flowcharts require a certain degree of detail (and accuracy) to provide useful benefit. Care and attention is required to ensure that the correct stakeholder is attributed to the correct parts of the process. Complex flowcharts may be difficult to interpret, especially where a flow is unclear, or many stakeholders are identified. Consistent terminology throughout the map is also important to provide clarity to the reader. [6]

A workflow is a generic term for orchestrated and repeatable patterns of activity, enabled by the systematic organization of resources into processes that transform materials, provide services, or process information. It can be depicted as a sequence of operations, the work of a person or group, the work of an organization of staff, or one or more simple or complex mechanisms.
A business process, business method or business function is a collection of related, structured activities or tasks performed by people or equipment in which a specific sequence produces a service or product for a particular customer or customers. Business processes occur at all organizational levels and may or may not be visible to the customers. A business process may often be visualized (modeled) as a flowchart of a sequence of activities with interleaving decision points or as a process matrix of a sequence of activities with relevance rules based on data in the process. The benefits of using business processes include improved customer satisfaction and improved agility for reacting to rapid market change. Process-oriented organizations break down the barriers of structural departments and try to avoid functional silos.
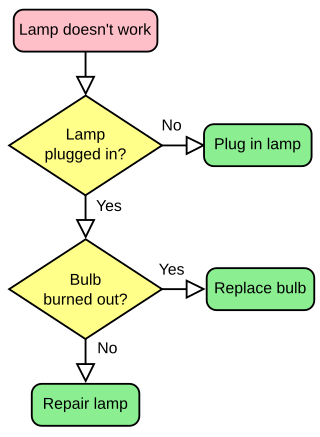
A flowchart is a type of diagram that represents a workflow or process. A flowchart can also be defined as a diagrammatic representation of an algorithm, a step-by-step approach to solving a task.

Microsoft Visio is a diagramming and vector graphics application and is part of the Microsoft 365 family. The product was first introduced in 1992 by former American software company Visio Corporation, and its latest version is Visio 2021. Microsoft acquired the assets of Visio Corporation in 2000 and thus also inherited the licensing agreements for the Visio application. A lightweight version of Visio is now included with all commercial SKU of Microsoft 365 and is known as Visio in Microsoft 365. It has two other subscription based SKUs. Visio Plan 1 includes the Visio web app whereas Visio Plan 2 provides access to both the web app as well as the Desktop application.

Flow diagram is a collective term for a diagram representing a flow or set of dynamic relationships in a system. The term flow diagram is also used as a synonym for flowchart, and sometimes as a counterpart of the flowchart.

A Nassi–Shneiderman diagram (NSD) in computer programming is a graphical design representation for structured programming. This type of diagram was developed in 1972 by Isaac Nassi and Ben Shneiderman who were both graduate students at Stony Brook University. These diagrams are also called structograms, as they show a program's structures.

Business Process Model and Notation (BPMN) is a graphical representation for specifying business processes in a business process model.
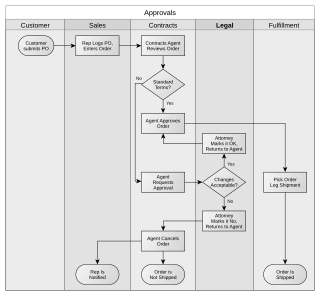
A swimlane is used in process flow diagrams, or flowcharts, that visually distinguishes job sharing and responsibilities for sub-processes of a business process. Swimlanes may be arranged either horizontally or vertically.

Unicom System Architect is an enterprise architecture tool that is used by the business and technology departments of corporations and government agencies to model their business operations and the systems, applications, and databases that support them. System Architect is used to build architectures using various frameworks including TOGAF, ArchiMate, DoDAF, MODAF, NAF and standard method notations such as sysML, UML, BPMN, and relational data modeling. System Architect is developed by UNICOM Systems, a division of UNICOM Global, a United States-based company.
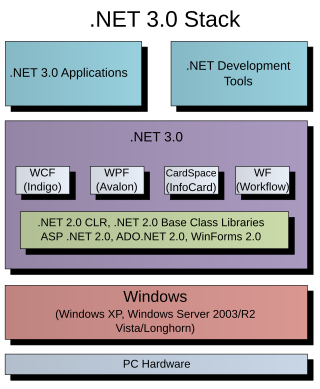
Windows Workflow Foundation (WF) is a Microsoft technology that provides an API, an in-process workflow engine, and a rehostable designer to implement long-running processes as workflows within .NET applications. The latest version of WF was released as part of the .NET Framework version 4.5 and is referred to as (WF45).
Business process mapping refers to activities involved in defining what a business entity does, who is responsible, to what standard a business process should be completed, and how the success of a business process can be determined.
A dot chart or dot plot is a statistical chart consisting of data points plotted on a fairly simple scale, typically using filled in circles. There are two common, yet very different, versions of the dot chart. The first has been used in hand-drawn graphs to depict distributions going back to 1884. The other version is described by William S. Cleveland as an alternative to the bar chart, in which dots are used to depict the quantitative values associated with categorical variables.
A workflow application is a software application that automates, to at least some degree, a process or processes. The processes are usually business-related but can be any process that requires a series of steps to be automated via software. Some steps of the process may require human intervention, such as approval or the development of custom text, but functions that can be automated should be handled by the application. Advanced applications allow users to introduce new components into the operation.

Misuse case is a business process modeling tool used in the software development industry. The term Misuse Case or mis-use case is derived from and is the inverse of use case. The term was first used in the 1990s by Guttorm Sindre of the Norwegian University of Science and Technology, and Andreas L. Opdahl of the University of Bergen, Norway. It describes the process of executing a malicious act against a system, while use case can be used to describe any action taken by the system.
In systems engineering, software engineering, and computer science, a function model or functional model is a structured representation of the functions within the modeled system or subject area.
Process map is a global-system process model that is used to outline the processes that make up the business system and how they interact with each other. Process map shows the processes as objects, which means it is a static and non-algorithmic view of the processes. It should be differentiated from a detailed process model, which shows a dynamic and algorithmic view of the processes, usually known as a process flow diagram. There are different notation standards that can be used for modelling process maps, but the most notable ones are TOGAF Event Diagram, Eriksson-Penker notation, and ARIS Value Added Chain.

Kanban is a lean method to manage and improve work across human systems. This approach aims to manage work by balancing demands with available capacity, and by improving the handling of system-level bottlenecks.

The flow process chart is a graphical and symbolic representation of the activities performed on the work piece during the operation in industrial engineering.
Business requirements, also known as stakeholder requirements specifications (StRS), describe the characteristics of a proposed system from the viewpoint of the system's end user like a CONOPS. Products, systems, software, and processes are ways of how to deliver, satisfy, or meet business requirements. Consequently, business requirements are often discussed in the context of developing or procuring software or other systems.
LibreOfficeDraw is a free and open source vector graphics editor. It is one of the applications included in the LibreOffice office suite, developed by The Document Foundation.