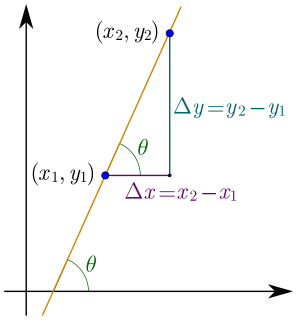
In mathematics, the slope or gradient of a line is a number that describes both the direction and the steepness of the line. Slope is often denoted by the letter m ; there is no clear answer to the question why the letter m is used for slope, but its earliest use in English appears in O'Brien (1844) who wrote the equation of a straight line as "y = mx + b" and it can also be found in Todhunter (1888) who wrote it as "y = mx + c".

In mathematics, the graph of a function is the set of ordered pairs , where In the common case where and are real numbers, these pairs are Cartesian coordinates of points in two-dimensional space and thus form a subset of this plane.
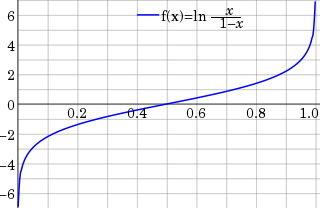
In statistics, the logit function is the quantile function associated with the standard logistic distribution. It has many uses in data analysis and machine learning, especially in data transformations.

In statistics, the (binary) logistic model is a statistical model that models the probability of one event taking place by having the log-odds for the event be a linear combination of one or more independent variables ("predictors"). In regression analysis, logistic regression is estimating the parameters of a logistic model. Formally, in binary logistic regression there is a single binary dependent variable, coded by a indicator variable, where the two values are labeled "0" and "1", while the independent variables can each be a binary variable or a continuous variable. The corresponding probability of the value labeled "1" can vary between 0 and 1, hence the labeling; the function that converts log-odds to probability is the logistic function, hence the name. The unit of measurement for the log-odds scale is called a logit, from logistic unit, hence the alternative names. See § Background and § Definition for formal mathematics, and § Example for a worked example.
In statistics, a generalized linear model (GLM) is a flexible generalization of ordinary linear regression. The GLM generalizes linear regression by allowing the linear model to be related to the response variable via a link function and by allowing the magnitude of the variance of each measurement to be a function of its predicted value.

In statistical modeling, regression analysis is a set of statistical processes for estimating the relationships between a dependent variable and one or more independent variables. The most common form of regression analysis is linear regression, in which one finds the line that most closely fits the data according to a specific mathematical criterion. For example, the method of ordinary least squares computes the unique line that minimizes the sum of squared differences between the true data and that line. For specific mathematical reasons, this allows the researcher to estimate the conditional expectation of the dependent variable when the independent variables take on a given set of values. Less common forms of regression use slightly different procedures to estimate alternative location parameters or estimate the conditional expectation across a broader collection of non-linear models.
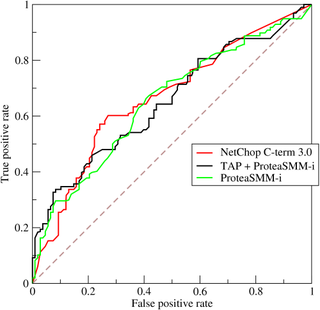
A receiver operating characteristic curve, or ROC curve, is a graphical plot that illustrates the diagnostic ability of a binary classifier system as its discrimination threshold is varied. The method was originally developed for operators of military radar receivers starting in 1941, which led to its name.
In statistics, a probit model is a type of regression where the dependent variable can take only two values, for example married or not married. The word is a portmanteau, coming from probability + unit. The purpose of the model is to estimate the probability that an observation with particular characteristics will fall into a specific one of the categories; moreover, classifying observations based on their predicted probabilities is a type of binary classification model.

In probability theory and statistics, the probit function is the quantile function associated with the standard normal distribution. It has applications in data analysis and machine learning, in particular exploratory statistical graphics and specialized regression modeling of binary response variables.

A psychometric function is an inferential psychometric model applied in detection and discrimination tasks. It models the relationship between a given feature of a physical stimulus, e.g. velocity, duration, brightness, weight etc., and forced-choice responses of a human or animal test subject. The psychometric function therefore is a specific application of the generalized linear model (GLM) to psychophysical data. The probability of response is related to a linear combination of predictors by means of a sigmoid link function.

In statistics, a Q–Q (quantile-quantile) plot is a probability plot, which is a graphical method for comparing two probability distributions by plotting their quantiles against each other. First, the set of intervals for the quantiles is chosen. A point (x, y) on the plot corresponds to one of the quantiles of the second distribution plotted against the same quantile of the first distribution. Thus the line is a parametric curve with the parameter which is the number of the interval for the quantile.
A radar tracker is a component of a radar system, or an associated command and control (C2) system, that associates consecutive radar observations of the same target into tracks. It is particularly useful when the radar system is reporting data from several different targets or when it is necessary to combine the data from several different radars or other sensors.
Non-linear least squares is the form of least squares analysis used to fit a set of m observations with a model that is non-linear in n unknown parameters (m ≥ n). It is used in some forms of nonlinear regression. The basis of the method is to approximate the model by a linear one and to refine the parameters by successive iterations. There are many similarities to linear least squares, but also some significant differences. In economic theory, the non-linear least squares method is applied in (i) the probit regression, (ii) threshold regression, (iii) smooth regression, (iv) logistic link regression, (v) Box-Cox transformed regressors.
The following outline is provided as an overview of and topical guide to regression analysis:
A time/memory/data tradeoff attack is a type of cryptographic attack where an attacker tries to achieve a situation similar to the space–time tradeoff but with the additional parameter of data, representing the amount of data available to the attacker. An attacker balances or reduces one or two of those parameters in favor of the other one or two. This type of attack is very difficult, so most of the ciphers and encryption schemes in use were not designed to resist it.
In statistics, linear regression is a linear approach for modelling the relationship between a scalar response and one or more explanatory variables. The case of one explanatory variable is called simple linear regression; for more than one, the process is called multiple linear regression. This term is distinct from multivariate linear regression, where multiple correlated dependent variables are predicted, rather than a single scalar variable.
In image analysis, the generalized structure tensor (GST) is an extension of the Cartesian structure tensor to curvilinear coordinates. It is mainly used to detect and to represent the "direction" parameters of curves, just as the Cartesian structure tensor detects and represents the direction in Cartesian coordinates. Curve families generated by pairs of locally orthogonal functions have been the best studied.
The total operating characteristic (TOC) is a statistical method to compare a Boolean variable versus a rank variable. TOC can measure the ability of an index variable to diagnose either presence or absence of a characteristic. The diagnosis of presence or absence depends on whether the value of the index is above a threshold. TOC considers multiple possible thresholds. Each threshold generates a two-by-two contingency table, which contains four entries: hits, misses, false alarms, and correct rejections.
In statistics, specifically regression analysis, a binary regression estimates a relationship between one or more explanatory variables and a single output binary variable. Generally the probability of the two alternatives is modeled, instead of simply outputting a single value, as in linear regression.

