| |||||||||||||||||||||||||||||||||||||||||||||||||||||||||
All 63 seats to Dublin City Council 32 seats needed for a majority | |||||||||||||||||||||||||||||||||||||||||||||||||||||||||
---|---|---|---|---|---|---|---|---|---|---|---|---|---|---|---|---|---|---|---|---|---|---|---|---|---|---|---|---|---|---|---|---|---|---|---|---|---|---|---|---|---|---|---|---|---|---|---|---|---|---|---|---|---|---|---|---|---|
| |||||||||||||||||||||||||||||||||||||||||||||||||||||||||
Map showing the area of Dublin City Council | |||||||||||||||||||||||||||||||||||||||||||||||||||||||||
|
A Dublin City Council election was held in Ireland on 23 May 2014 as part of that year's local elections. Sixty-three councillors were elected for a five-year term of office from nine local electoral areas by proportional representation with a single transferable vote. [1] [2] [3]
Dublin City Council is the authority responsible for local government in the city of Dublin in Ireland. As a city council, it is governed by the Local Government Act 2001. Until 2001, the council was known as "Dublin Corporation". The council is responsible for housing and community, roads and transportation, urban planning and development, amenity and culture and environment. The council has 63 elected members and is the largest local council in Ireland. Elections are held every five years and are by single transferable vote. The head of the council has the honorific title of Lord Mayor. The city administration is headed by a Chief Executive, Owen Keegan. The council meets at City Hall, Dublin.
Dublin City Council was expanded to 63 seats for the 2014 elections. Sinn Féin won 16 seats, a gain of 7 seats, to emerge as the largest party and at least 1 seat in every LEA except Rathgar-Rathmines. Fianna Fáil won 9 seats, a gain of 3 seats in total. The party won 2 seats in Clontarf and 1 seat in every LEA except the North-Inner City. Fine Gael lost 4 seats to return with 8 seats overall. The party won 2 seats in Pembroke-Southdock and Rathgar-Rathmines but found itself without representation in Ballyfermot-Drimnagh, Cabra-Finglas and Crumlin-Kimmage. The Labour Party had a terrible election losing 11 seats in all, including their outgoing Lord Mayor, Oisin Quinn, to return with just 8 councillors in all. People Before Profit gained 3 seats to return with 5 seats in all and the Green Party made a return to the Council with 3 seats. The United Left Alliance and the Anti-Austerity Alliance both returned 1 seat while Independents doubled their numbers to 12 seats.
Party | Seats | ± | 1st pref | FPv% | |
---|---|---|---|---|---|
Sinn Féin | 16 | +9 | 33,393 | 24.22 | |
Fianna Fáil | 9 | +3 | 19,957 | 14.47 | |
Fine Gael | 8 | -4 | 19,325 | 14.02 | |
Labour Party | 8 | -11 | 17,524 | 12.71 | |
People Before Profit | 5 | +3 | 9,544 | 6.92 | |
Green Party | 3 | +3 | 7,000 | 5.08 | |
United Left | 1 | +1 | 2,180 | 1.58 | |
Anti-Austerity Alliance | 1 | +1 | 2,025 | 1.47 | |
Independent | 12 | +6 | 24,470 | 17.75 | |
Totals | 63 | +11 | 137,879 | 100% |
Ballyfermot-Drimnagh - 6 Seats | |||||||||||||||
---|---|---|---|---|---|---|---|---|---|---|---|---|---|---|---|
Party | Candidate | % 1st Pref | Count 1 | Count 2 | Count 3 | Count 4 | Count 5 | Count 6 | Count 7 | Count 8 | Count 9 | Count 10 | Count 11 | Count 12 | |
Sinn Féin | Daithí Doolan | 19.28% | 2,834 | ||||||||||||
People Before Profit | Bríd Smith *††††††††† | 13.82% | 2,031 | 2,091 | 2,130 | ||||||||||
Independent | Paul Hand | 8.84% | 1,300 | 1,327 | 1,403 | 1,516 | 1,517 | 1,608 | 1,680 | 1,799 | 1,845 | 1,924 | 1,954 | 2,151 | |
Fianna Fáil | Daithí De Róiste | 8.74% | 1,284 | 1,305 | 1,318 | 1,335 | 1,337 | 1,346 | 1,391 | 1,408 | 1,460 | 1,531 | 1,551 | 1,695 | |
Independent | Vincent Jackson * | 7.97% | 1,171 | 1,203 | 1,261 | 1,311 | 1,316 | 1,336 | 1,379 | 1,476 | 1,606 | 1,728 | 1,775 | 1,902 | |
Sinn Féin | Greg Kelly | 7.75% | 1,139 | 1,638 | 1,669 | 1,695 | 1,696 | 1,743 | 1,768 | 1,898 | 1,937 | 2,209 | |||
Fine Gael | Philip Nolan | 5.82% | 856 | 859 | 862 | 917 | 918 | 930 | 989 | 1,007 | 1,121 | 1,146 | 1,151 | ||
Labour Party | Michael O'Sullivan* | 4.79% | 704 | 705 | 710 | 721 | 721 | 749 | 818 | 852 | 1,140 | 1,164 | 1,171 | 1,518 | |
Labour Party | Sheila Howes* | 4.42% | 650 | 660 | 672 | 689 | 690 | 698 | 797 | 814 | |||||
Éirígí | Louise Minihan* | 4.35% | 639 | 677 | 699 | 720 | 724 | 737 | 760 | 818 | 857 | ||||
Green Party | Oisín Ó hAlmhain | 3.74% | 550 | 554 | 558 | 571 | 571 | 587 | |||||||
United Left | Brian Stafford | 2.90% | 426 | 430 | 437 | 445 | 448 | ||||||||
People Before Profit | Paul Shields | 2.78% | 409 | 420 | 437 | 465 | 477 | 634 | 690 | ||||||
Independent | Peter O'Neill | 2.51% | 369 | 374 | 399 | ||||||||||
Independent | Henry Harding | 1.20% | 176 | ||||||||||||
Independent | Noel Bennett | 0.69% | 102 | 106 | |||||||||||
Independent | Laurence Vize | 0.39% | 58 | 60 | |||||||||||
Electorate: 34,597 Valid: 14,698 (42.48%) Spoilt: 272 Quota: 2,100 Turnout: 14,970 (43.27%) |
Ballymun - 7 Seats | ||||||||||||||||||
---|---|---|---|---|---|---|---|---|---|---|---|---|---|---|---|---|---|---|
Party | Candidate | % 1st Pref | Count 1 | Count 2 | Count 3 | Count 4 | Count 5 | Count 6 | Count 7 | Count 8 | Count 9 | Count 10 | Count 11 | Count 12 | Count 13 | Count 14 | Count 15 | |
Sinn Féin | Noeleen Reilly†††††††††††† | 14.82% | 2,540 | |||||||||||||||
Sinn Féin | Cathleen Carney Boud | 13.58% | 2,328 | |||||||||||||||
Labour Party | Andrew Montague * | 9.16% | 1,570 | 1,618 | 1,626 | 1,643 | 1,646 | 1,651 | 1,663 | 1,687 | 1,710 | 1,733 | 1,798 | 1,870 | 1,998 | 2,158 | ||
Fianna Fáil | Paul McAuliffe* | 8.69% | 1,490 | 1,503 | 1,514 | 1,518 | 1,520 | 1,531 | 1,541 | 1,554 | 1,568 | 1,588 | 1,653 | 1,679 | 1,740 | 1,830 | 1,936 | |
Fine Gael | Noel Rock †††† | 7.27% | 1,247 | 1,256 | 1,262 | 1,266 | 1,275 | 1,285 | 1,290 | 1,310 | 1,319 | 1,370 | 1,544 | 1,603 | 1,680 | 2,166 | ||
Fianna Fáil | Laura Reid | 6.58% | 1,128 | 1,146 | 1,154 | 1,162 | 1,169 | 1,183 | 1,189 | 1,212 | 1,220 | 1,252 | 1,291 | 1,327 | 1,381 | 1,436 | 1,531 | |
Labour Party | Aine Clancy* | 5.50% | 943 | 952 | 958 | 961 | 965 | 969 | 972 | 999 | 1,016 | 1,034 | 1,096 | 1,118 | 1,276 | 1,496 | 1,606 | |
Fine Gael | Gerry Breen* | 5.39% | 924 | 929 | 931 | 934 | 938 | 938 | 939 | 948 | 955 | 992 | 1,129 | 1,144 | 1,183 | |||
Green Party | Caroline Conroy | 4.30% | 738 | 764 | 780 | 784 | 789 | 794 | 817 | 855 | 885 | 912 | 949 | 997 | ||||
Fine Gael | Dr. Bill Tormey* | 3.95% | 678 | 689 | 692 | 694 | 700 | 700 | 707 | 718 | 729 | 754 | ||||||
People Before Profit | Andrew Keegan | 3.74% | 642 | 711 | 744 | 762 | 769 | 807 | 907 | 930 | 1,066 | 1,116 | 1,150 | 1,289 | 1,444 | 1,473 | 1,869 | |
Independent | Geraldine Gough | 3.54% | 607 | 626 | 642 | 655 | 672 | 689 | 725 | 748 | 780 | 889 | 911 | 1,113 | 1,238 | 1,279 | ||
Independent | Seán Tyrrell | 2.74% | 470 | 527 | 537 | 547 | 585 | 595 | 623 | 707 | 755 | 843 | 871 | |||||
Independent | Peter McDonnell | 2.44% | 418 | 425 | 428 | 457 | 465 | 479 | 497 | 550 | 567 | |||||||
Workers' Party | Owen Martin | 2.10% | 360 | 397 | 426 | 429 | 433 | 440 | 466 | 477 | ||||||||
Independent | Agnieszka Wieczorkowska | 1.97% | 338 | 351 | 357 | 363 | 389 | 397 | 411 | |||||||||
Anti-Austerity Alliance | Helen Metcalfe | 1.50% | 258 | 285 | 299 | 305 | 314 | 330 | ||||||||||
Direct Democracy | Cormac McKay | 0.94% | 162 | 173 | 179 | 183 | 184 | |||||||||||
Independent | Cearuil Swords | 0.91% | 156 | 165 | 170 | 177 | ||||||||||||
Independent | Austin McCoy | 0.85% | 146 | 155 | 158 | |||||||||||||
Electorate: 38,875 Valid: 17,143 (44.10%) Spoilt: 311 Quota: 2,143 Turnout: 17,454 (44.90%) |
Beaumont-Donaghmede - 9 Seats | |||||||||||||||||
---|---|---|---|---|---|---|---|---|---|---|---|---|---|---|---|---|---|
Party | Candidate | % 1st Pref | Count 1 | Count 2 | Count 3 | Count 4 | Count 5 | Count 6 | Count 7 | Count 8 | Count 9 | Count 10 | Count 11 | Count 12 | Count 13 | Count 14 | |
Sinn Féin | Larry O'Toole* | 15.29% | 3,337 | ||||||||||||||
Fianna Fáil | Tom Brabazon* | 10.70% | 2,334 | ||||||||||||||
People Before Profit | John Lyons | 10.60% | 2,313 | ||||||||||||||
Sinn Féin | Micheál MacDonncha* | 10.29% | 2,245 | ||||||||||||||
Sinn Féin | Denise Mitchell ††††† | 9.08% | 1,982 | 2,781 | |||||||||||||
Fine Gael | Declan Flanagan* | 6.49% | 1,415 | 1,429 | 1,442 | 1,457 | 1,460 | 1,579 | 1,584 | 1,586 | 1,592 | 1,621 | 1,634 | 2,012 | 2,221 | ||
Independent | Paddy Bourke * | 5.33% | 1,163 | 1,214 | 1,278 | 1,287 | 1,299 | 1,305 | 1,337 | 1,345 | 1,364 | 1,415 | 1,462 | 1,484 | 1,545 | 2,080 | |
Fianna Fáil | Sean Paul Mahon* | 4.74% | 1,034 | 1,068 | 1,090 | 1,170 | 1,173 | 1,181 | 1,187 | 1,190 | 1,194 | 1,227 | 1,247 | 1,288 | 1,345 | 1,384 | |
Labour Party | Brian McDowell* | 4.19% | 914 | 929 | 937 | 947 | 950 | 961 | 966 | 969 | 972 | 1,005 | 1,010 | 1,101 | |||
Anti-Austerity Alliance | Michael O'Brien | 4.15% | 906 | 961 | 1,050 | 1,057 | 1,105 | 1,106 | 1,169 | 1,187 | 1,544 | 1,624 | 1,812 | 1,840 | 1,921 | 2,205 | |
Labour Party | Alison Gilliland | 4.00% | 873 | 895 | 914 | 919 | 923 | 937 | 945 | 946 | 951 | 1,019 | 1,033 | 1,144 | 1,569 | 1,637 | |
Independent | Paul Clarke | 3.82% | 833 | 865 | 909 | 919 | 943 | 949 | 1,006 | 1,014 | 1,037 | 1,095 | 1,203 | 1,224 | 1,278 | ||
Fine Gael | Stephanie Regan | 3.15% | 688 | 699 | 703 | 709 | 710 | 737 | 746 | 747 | 752 | 796 | 808 | ||||
Éirígí | Ciarán Heaphey | 2.35% | 512 | 563 | 647 | 650 | 659 | 660 | 678 | 686 | 697 | 716 | |||||
Green Party | Ian Smyth | 2.03% | 442 | 456 | 479 | 485 | 490 | 492 | 515 | 520 | 525 | ||||||
Anti-Austerity Alliance | Pronsias O Conaráin | 1.61% | 351 | 379 | 408 | 411 | 421 | 424 | 483 | 489 | |||||||
Direct Democracy | Tom Rooney | 1.30% | 284 | 309 | 341 | 343 | 352 | 352 | |||||||||
Fine Gael | Ciarán Byrne | 0.88% | 193 | 197 | 199 | 203 | 203 | ||||||||||
Electorate: 49,839 Valid: 21,819 (43.78%) Spoilt: 408 Quota: 2,182 Turnout: 22,227 (44.60%) |
Cabra-Finglas - 7 Seats | ||||||||||||||||
---|---|---|---|---|---|---|---|---|---|---|---|---|---|---|---|---|
Party | Candidate | % 1st Pref | Count 1 | Count 2 | Count 3 | Count 4 | Count 5 | Count 6 | Count 7 | Count 8 | Count 9 | Count 10 | Count 11 | Count 12 | Count 13 | |
Independent | Cieran Perry* | 13.47% | 2,269 | |||||||||||||
Sinn Féin | Anthony Connaghan* | 13.10% | 2,207 | |||||||||||||
Sinn Féin | Emma Murphy | 12.79% | 2,155 | |||||||||||||
Sinn Féin | Seamus McGrattan* | 10.99% | 1,852 | 1,893 | 1,958 | 1,979 | 2,012 | 2,037 | 2,062 | 2,082 | 2,175 | |||||
Fianna Fáil | David Costello | 7.79% | 1,313 | 1,318 | 1,323 | 1,354 | 1,356 | 1,502 | 1,523 | 1,546 | 1,564 | 1,565 | 1,911 | 2,013 | 2,162 | |
Labour Party | Brendan Carr | 7.29% | 1,229 | 1,242 | 1,262 | 1,263 | 1,264 | 1,279 | 1,403 | 1,520 | 1,566 | 1,572 | 1,643 | 1,878 | 2,292 | |
Independent | Teresa Keegan | 6.74% | 1,135 | 1,171 | 1,175 | 1,194 | 1,197 | 1,210 | 1,243 | 1,321 | 1,448 | 1,453 | 1,518 | 1,652 | 1,768 | |
United Left | Bernie Hughes | 4.20% | 707 | 723 | 733 | 753 | 756 | 758 | 767 | 791 | 1,027 | 1,051 | 1,069 | 1,171 | 1,185 | |
Fine Gael | David Rouse | 3.82% | 643 | 645 | 645 | 806 | 806 | 818 | 852 | 904 | 917 | 917 | 953 | 1,011 | ||
Labour Party | John Redmond* | 3.50% | 589 | 591 | 594 | 641 | 643 | 647 | 722 | 763 | 779 | 781 | 794 | |||
People Before Profit | Gaughran David | 3.10% | 522 | 540 | 546 | 551 | 553 | 557 | 580 | 654 | ||||||
Fianna Fáil | Paul Anthony Ward | 3.00% | 506 | 513 | 514 | 519 | 519 | 689 | 723 | 737 | 742 | 742 | ||||
Green Party | Tom Duffy | 2.72% | 459 | 465 | 467 | 475 | 476 | 482 | 520 | |||||||
Fianna Fáil | Darren Lehane | 2.62% | 441 | 444 | 445 | 449 | 449 | |||||||||
Labour Party | Declan Meenagh | 2.61% | 440 | 449 | 449 | 457 | 458 | 471 | ||||||||
Fine Gael | Jimmy Prendergast | 2.28% | 384 | 388 | 390 | |||||||||||
Electorate: 37,487 Valid: 16,851 (44.95%) Spoilt: 319 Quota: 2,107 Turnout: 17,170 (45.80%) |
Clontarf - 6 Seats | ||||||||||||
---|---|---|---|---|---|---|---|---|---|---|---|---|
Party | Candidate | % 1st Pref | Count 1 | Count 2 | Count 3 | Count 4 | Count 5 | Count 6 | Count 7 | Count 8 | Count 9 | |
Independent | Damien O'Farrell* | 20.56% | 3,926 | |||||||||
Fianna Fáil | Seán Haughey †††††† | 12.78% | 2,440 | 2,525 | 2,548 | 2,691 | 2,794 | |||||
Fianna Fáil | Deirdre Heney* | 11.39% | 2,175 | 2,293 | 2,316 | 2,390 | 2,479 | 2,510 | 2,663 | 2,715 | 2,809 | |
Fine Gael | Naoise O Muiri * | 10.36% | 1,979 | 2,144 | 2,155 | 2,365 | 2,440 | 2,450 | 3,042 | |||
Labour Party | Jane Horgan-Jones* | 10.17% | 1,943 | 2,110 | 2,131 | 2,224 | 2,314 | 2,320 | 2,524 | 2,710 | 2,833 | |
Sinn Féin | Ciarán O'Moore | 9.41% | 1,798 | 1,898 | 1,988 | 2,013 | 2,111 | 2,115 | 2,136 | 2,141 | 2,564 | |
Green Party | Donna Cooney | 4.94% | 943 | 1,042 | 1,063 | 1,128 | 1,255 | 1,258 | 1,370 | 1,430 | 1,704 | |
Fine Gael | Jimmy Bowler | 4.91% | 938 | 1,000 | 1,005 | 1,199 | 1,235 | 1,238 | ||||
Fine Gael | Pat Crimmins* | 4.75% | 907 | 926 | 934 | |||||||
People Before Profit | Pat Doherty | 4.26% | 814 | 904 | 1,137 | 1,164 | 1,374 | 1,382 | 1,418 | 1,428 | ||
Independent | Philip Grogan | 3.80% | 726 | 923 | 1,039 | 1,071 | ||||||
Anti-Austerity Alliance | Philip Wright | 2.67% | 510 | 601 | ||||||||
Electorate: 28,420 Valid: 19,099 (67.20%) Spoilt: 219 Quota: 2,729 Turnout: 19,318 (67.97%) |
Crumlin-Kimmage - 6 Seats | |||||||||||||||||
---|---|---|---|---|---|---|---|---|---|---|---|---|---|---|---|---|---|
Party | Candidate | % 1st Pref | Count 1 | Count 2 | Count 3 | Count 4 | Count 5 | Count 6 | Count 7 | Count 8 | Count 9 | Count 10 | Count 11 | Count 12 | Count 13 | Count 14 | |
Sinn Féin | Críona Ní Dhálaigh * | 13.48% | 1,528 | 1,531 | 1,543 | 1,568 | 1,575 | 1,582 | 1,592 | 1,610 | 1,753 | ||||||
Sinn Féin | Ray McHugh | 12.72% | 1,442 | 1,445 | 1,455 | 1,470 | 1,480 | 1,494 | 1,500 | 1,509 | 1,612 | 1,671 | |||||
People Before Profit | Tina McVeigh | 11.56% | 1,310 | 1,338 | 1,363 | 1,405 | 1,431 | 1,452 | 1,465 | 1,547 | 1,662 | ||||||
United Left | Pat Dunne* | 9.24% | 1,047 | 1,062 | 1,067 | 1,085 | 1,098 | 1,127 | 1,134 | 1,154 | 1,186 | 1,189 | 1,241 | 1,255 | 1,316 | 1,345 | |
Labour Party | Rebecca Moynihan* | 8.65% | 981 | 994 | 1,032 | 1,047 | 1,054 | 1,069 | 1,108 | 1,218 | 1,243 | 1,248 | 1,518 | 1,521 | 1,902 | ||
Fianna Fáil | Catherine Ardagh | 7.56% | 857 | 861 | 871 | 874 | 1,033 | 1,049 | 1,067 | 1,092 | 1,111 | 1,114 | 1,161 | 1,161 | 1,303 | 1,390 | |
Independent | Paul Dillon | 5.73% | 649 | 674 | 678 | 729 | 736 | 871 | 886 | 952 | 995 | 1,000 | 1,045 | 1,053 | 1,138 | 1,191 | |
Éirígí | Damien Farrell | 4.89% | 554 | 557 | 558 | 566 | 571 | 584 | 585 | 589 | |||||||
Fine Gael | Edel James | 4.55% | 516 | 525 | 533 | 537 | 550 | 559 | 764 | 813 | 832 | 833 | 968 | 970 | |||
Labour Party | Gary Honer | 4.48% | 508 | 515 | 560 | 567 | 576 | 585 | 611 | 663 | 677 | 682 | |||||
Green Party | Sandra Dunne | 3.76% | 426 | 439 | 452 | 466 | 474 | 478 | 489 | ||||||||
Fine Gael | Jason O'Callaghan | 3.07% | 348 | 354 | 361 | 365 | 370 | 376 | |||||||||
Fianna Fáil | Aoife Donoghue | 2.58% | 293 | 294 | 299 | 301 | |||||||||||
Independent | Tony Byrne | 2.36% | 267 | 274 | 282 | 302 | 310 | ||||||||||
Independent | John J. O'Donovan | 1.94% | 220 | 254 | 260 | ||||||||||||
Labour Party | John Gallagher* | 1.78% | 202 | 203 | |||||||||||||
Independent | Christian Hayden | 1.03% | 117 | ||||||||||||||
Independent | Lech Szczecinski | 0.62% | 70 | ||||||||||||||
Electorate: 29,575 Valid: 11,335 (38.33%) Spoilt: 246 Quota: 1,620 Turnout: 11,581 (39.16%) |
North Inner City - 8 Seats | ||||||||||||||||
---|---|---|---|---|---|---|---|---|---|---|---|---|---|---|---|---|
Party | Candidate | % 1st Pref | Count 1 | Count 2 | Count 3 | Count 4 | Count 5 | Count 6 | Count 7 | Count 8 | Count 9 | Count 10 | Count 11 | Count 12 | Count 13 | |
Sinn Féin | Janice Boylan | 13.52% | 1,393 | |||||||||||||
Independent | Christy Burke * | 12.01% | 1,238 | |||||||||||||
Independent | Nial Ring* | 9.62% | 991 | 995 | 1,009 | 1,013 | 1,018 | 1,021 | 1,096 | 1,109 | 1,172 | |||||
Sinn Féin | Johnathan Dowdall | 7.09% | 731 | 865 | 886 | 891 | 891 | 895 | 917 | 918 | 957 | 1,060 | 1,094 | 1,113 | 1,114 | |
Green Party | Ciaran Cuffe | 7.03% | 724 | 733 | 737 | 740 | 753 | 762 | 767 | 772 | 829 | 858 | 933 | 1,098 | 1,100 | |
Independent | Gary Gannon | 7.19% | 741 | 752 | 766 | 784 | 805 | 811 | 837 | 843 | 904 | 987 | 1,039 | 1,073 | 1,079 | |
Fine Gael | Ray McAdam | 5.88% | 606 | 610 | 611 | 613 | 621 | 633 | 635 | 786 | 804 | 815 | 868 | 1,030 | 1,032 | |
Independent | Eilis Ryan† | 6.09% | 628 | 635 | 638 | 647 | 660 | 663 | 681 | 687 | 745 | 771 | 840 | 940 | 950 | |
Sinn Féin | Gaye Fagan | 7.10% | 732 | 786 | 799 | 804 | 804 | 808 | 825 | 827 | 847 | 873 | 909 | 941 | 947 | |
Labour Party | Lucy McRoberts | 4.10% | 422 | 423 | 423 | 425 | 427 | 510 | 511 | 534 | 556 | 672 | 703 | |||
Fianna Fáil | Brian Mohan | 4.95% | 510 | 513 | 515 | 516 | 522 | 528 | 533 | 541 | 559 | 570 | ||||
Labour Party | Darryl O'Callaghan | 4.04% | 416 | 422 | 429 | 429 | 429 | 447 | 454 | 462 | 490 | |||||
Independent | Mel MacGiobúin* | 3.96% | 408 | 413 | 420 | 422 | 429 | 434 | 445 | 447 | ||||||
Fine Gael | Patrick Martin | 2.21% | 228 | 229 | 230 | 232 | 234 | 241 | 251 | |||||||
Independent | Malachy Steenson | 2.11% | 217 | 218 | 220 | 224 | 224 | 224 | ||||||||
Labour Party | Padraig McLoughlin* | 1.57% | 162 | 164 | 165 | 166 | 167 | |||||||||
Independent | Rafal Kornatka | 0.88% | 91 | 92 | 93 | 98 | ||||||||||
Independent | Eva de Winter | 0.38% | 39 | 44 | 46 | |||||||||||
Independent | Philip Lee | 0.26% | 27 | 27 | 27 | |||||||||||
Electorate: 28,900 Valid: 10,304 (35.65%) Spoilt: 243 Quota: 1,145 Turnout: 10,547 (36.49%) |
Pembroke-South Dock - 8 Seats | ||||||||||||||
---|---|---|---|---|---|---|---|---|---|---|---|---|---|---|
Party | Candidate | % 1st Pref | Count 1 | Count 2 | Count 3 | Count 4 | Count 5 | Count 6 | Count 7 | Count 8 | Count 9 | Count 10 | Count 11 | |
Sinn Féin | Chris Andrews | 15.07% | 2,081 | |||||||||||
Fianna Fáil | Frank Kennedy | 10.05% | 1,388 | 1,407 | 1,408 | 1,434 | 1,440 | 1,493 | 1,495 | 1,543 | ||||
Labour Party | Dermot Lacey * | 9.72% | 1,343 | 1,361 | 1,365 | 1,380 | 1,469 | 1,495 | 1,497 | 1,830 | ||||
Independent | Mannix Flynn * | 9.64% | 1,331 | 1,453 | 1,478 | 1,569 | ||||||||
Green Party | Claire Byrne | 7.75% | 1,071 | 1,132 | 1,148 | 1,172 | 1,216 | 1,291 | 1,299 | 1,353 | 1,424 | 1,466 | 1,642 | |
Fine Gael | Paddy McCartan* | 7.39% | 1,021 | 1,032 | 1,033 | 1,041 | 1,051 | 1,068 | 1,068 | 1,093 | 1,140 | 1,306 | 1,393 | |
Fine Gael | Kieran Binchy* | 7.30% | 1,008 | 1,015 | 1,017 | 1,025 | 1,062 | 1,074 | 1,074 | 1,114 | 1,141 | 1,293 | 1,376 | |
People Before Profit | Sonya Stapleton††††††††††† | 5.60% | 773 | 927 | 938 | 966 | 977 | 1,155 | 1,170 | 1,203 | 1,231 | 1,246 | 1,332 | |
Fianna Fáil | Lorraine Clifford | 5.41% | 747 | 781 | 783 | 790 | 808 | 838 | 840 | 865 | 874 | 918 | ||
Fine Gael | Linda O'Shea-Farren | 4.77% | 659 | 661 | 662 | 665 | 671 | 691 | 691 | 706 | 724 | |||
Fine Gael | Nadine Meisonnave | 4.67% | 645 | 647 | 651 | 662 | 673 | 696 | 698 | 734 | 760 | 1,007 | 1,117 | |
Independent | Anne Maree Quinn | 3.70% | 511 | 541 | 555 | 606 | 611 | |||||||
Labour Party | James Humphreys | 3.66 | 506 | 523 | 528 | 539 | 653 | 683 | 686 | |||||
Labour Party | Gerry Ashe* | 2,43 | 336 | 354 | 363 | 369 | ||||||||
Independent | Wayne Flanagan-Tobin | 1.89% | 261 | 289 | 326 | |||||||||
Independent | Marcin Czechowicz | 0.32% | 44 | 59 | ||||||||||
Independent | Christian Hayden | 0.31% | 43 | 50 | ||||||||||
Independent | Galen MacCaba | 0.31% | 43 | 44 | ||||||||||
Electorate: 39,209 Valid: 13,811 (35.22%) Spoilt: 202 Quota: 1,535 Turnout: 14,013 (35.74%) |
Rathgar-Rathmines - 6 Seats | ||||||||||||||
---|---|---|---|---|---|---|---|---|---|---|---|---|---|---|
Party | Candidate | % 1st Pref | Count 1 | Count 2 | Count 3 | Count 4 | Count 5 | Count 6 | Count 7 | Count 8 | Count 9 | Count 10 | Count 11 | |
Green Party | Patrick Costello | 12.85% | 1,647 | 1,707 | 1,742 | 1,745 | 1,892 | |||||||
Fine Gael | Kate O'Connell ††††††† | 12.60% | 1,615 | 1,636 | 1,958 | |||||||||
Labour Party | Mary Freehill * | 9.43% | 1,209 | 1,239 | 1,296 | 1,303 | 1,356 | 1,370 | 1,658 | 1,727 | 2,221 | |||
Sinn Féin | Dominic MacConraoi | 8.34% | 1,069 | 1,086 | 1,093 | 1,094 | 1,294 | 1,313 | 1,334 | 1,387 | 1,435 | 1,480 | 1,488 | |
Fianna Fáil | Jim O'Callaghan *†††††††† | 8.24% | 1,056 | 1,070 | 1,082 | 1,084 | 1,101 | 1,102 | 1,234 | 1,845 | ||||
Fine Gael | Dr. Paddy Smyth | 8.24% | 1,056 | 1,065 | 1,222 | 1,311 | 1,322 | 1,322 | 1,473 | 1,534 | 1,714 | 1,879 | ||
Fianna Fáil | Daniel Donnelly | 7.50% | 961 | 981 | 1,001 | 1,004 | 1,014 | 1,015 | 1,035 | |||||
Labour Party | Oisín Quinn* | 6.40 | 820 | 825 | 840 | 849 | 869 | 873 | ||||||
Independent | Ruairi McGinley* | 6.36% | 815 | 893 | 928 | 932 | 1,108 | 1,126 | 1,163 | 1,257 | 1,426 | 1,536 | 1,575 | |
Labour Party | Henry Upton* | 5.96 | 764 | 782 | 841 | 847 | 883 | 886 | 1,037 | 1,088 | ||||
People Before Profit | Kim O'Donnell | 5.69% | 730 | 786 | 793 | 795 | ||||||||
Fine Gael | Samantha Long | 5.62% | 721 | 732 | ||||||||||
Independent | Ethna Tinney | 2.78% | 356 | |||||||||||
Electorate: 32,122 Valid: 12,819 (39.91%) Spoilt: 157 Quota: 1,832 Turnout: 12,976 (40.40%) |
Eric Byrne is a former Irish Labour Party politician who served as a Teachta Dála (TD) for the Dublin South-Central constituency from 1989 to 1992, 1994 to 1997 and 2011 to 2016.
An election to Monaghan County Council took place on 23 May 2014 as part of that year's Irish local elections. 18 councillors were elected from three electoral divisions by PR-STV voting for a five-year term of office, a reduction of 2 seats compared to 2009. Monaghan also saw a further reduction in elected representation as Ballybay Town Council, Carrickmacross Town Council, Castleblayney Town Council, Clones Town Council and Monaghan Town Council were all abolished.
An election to Galway County Council took place on 23 May 2014 as part of that year's Irish local elections. 39 councillors were elected from five electoral divisions by PR-STV voting for a five-year term of office, an increase in 9 seats from 2009. In addition Ballinasloe Town Council, Loughrea Town Council and Tuam Town Council were all abolished.
An election to Galway City Council took place on 23 May 2014 as part of that year's Irish local elections. 18 councillors were elected from three electoral divisions by PR-STV voting for a five-year term of office, an increase of 3 seats when compared to 2009.
An election to Louth County Council took place on 23 May 2014 as part of that year's Irish local elections. 29 councillors were elected from four electoral divisions by PR-STV voting for a five-year term of office. Ahead of the 2014 election Louth was redrawn into four electoral areas, a reduction of one from five, and the number of councillors was increased to 29, from a previous total of 26. Drogheda Borough Council, Dundalk Town Council and Ardee Town Council were all abolished.
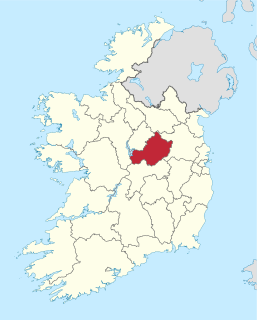
An election to Westmeath County Council took place on 23 May 2014 as part of that year's Irish local elections. 20 councillors were elected from three electoral divisions by PR-STV voting for a five-year term of office, a reduction of 3 seats compared to 2009. In addition Athlone Town Council and Mullingar Town Council were both abolished.
An election to Meath County Council took place on 23 May 2014 as part of that year's Irish local elections. 40 councillors were elected from six electoral divisions by PR-STV voting for a five-year term of office, an increase of 11 seats from 2009.
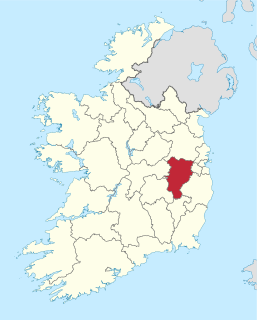
An election to Kildare County Council took place on 23 May 2014 as part of that year's Irish local elections. 40 councillors were elected from five electoral divisions by PR-STV voting for a five-year term of office, an increase in 15 seats compared to 2009. In addition Athy Town Council, Leixlip Town Council, Naas Town Council and Newbridge Town Council were all abolished.
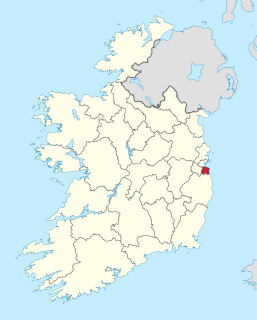
A Dún Laoghaire–Rathdown County Council election was held in Ireland on 23 May 2014 as part of that year's local elections. Forty councillors were elected from a field of 85 candidates for a five-year term of office from six local electoral areas by proportional representation with a single transferable vote.
A Fingal County Council election was held in Ireland on 23 May 2014 as part of that year's local elections. Forty councillors were elected from a field of 97 candidates for a five-year term of office from five local electoral areas by proportional representation with a single transferable vote.
An election to South Dublin County Council took place on 23 May 2014 as part of that year's Irish local elections. Forty councillors were elected from six local electoral areas by proportional representation with a single transferable vote for a five-year term of office.
A Mayo County Council election was held in Ireland on 23 May 2014 as part of that year's local elections. Thirty councillors were elected for a five-year term of office from four local electoral areas by proportional representation with a single transferable vote. This represented a reduction of 1 councillor since 2009 and 1 a reduction in 2 electoral areas.
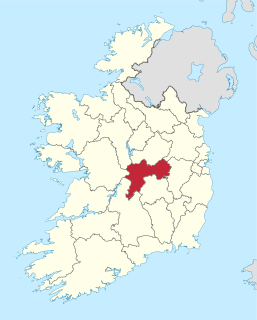
An election to Offaly County Council took place on 23 May 2014 as part of that year's Irish local elections. 19 councillors were elected from three electoral divisions by PR-STV voting for a five-year term of office, a reduction of 2 seats from the previous election in 2009. In addition Birr Town Council, Edenderry Town Council and Tullamore Town Council were all abolished.
An election to Kilkenny County Council took place on 23 May 2014 as part of that year's Irish local elections. 24 councillors were elected from three electoral divisions by PR-STV voting for a five-year term of office, a reduction of 2 seats from the previous election in 2009. In addition the Kilkenny Borough Council was abolished.
An election to Wexford County Council took place on 23 May 2014 as part of that year's Irish local elections. 34 councillors were elected from three electoral divisions by PR-STV voting for a five-year term of office, an increase of 13 seats from the previous election in 2009. In addition the Wexford Borough Council, Enniscorthy Town Council, Gorey Town Council and New Ross Town Council were all abolished.
An election to Wicklow County Council took place on 23 May 2014 as part of that year's Irish local elections. 32 councillors were elected from five electoral divisions by PR-STV voting for a five-year term of office, an increase of 8 seats from the previous election in 2009. In addition Arklow Town Council, Bray Town Council, Greystones Town Council and Wicklow Town Council were all abolished, as per the Local Government Reform Act 2014.
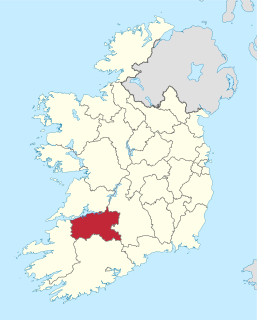
An election to Limerick City and County Council took place on 23 May 2014 as part of that year's Irish local elections. 40 councillors were elected from six electoral divisions by PR-STV voting for a five-year term of office. This is a new local authority which was formed out of a merger from the abolished Limerick City Council and Limerick County Councils.
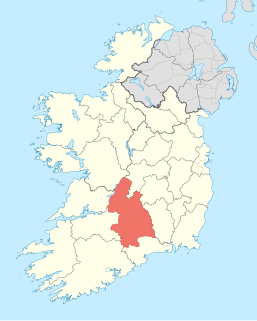
A Tipperary County Council election was held in Ireland on 23 May 2014 as part of that year's local elections. Forty councillors were elected from a field of 85 candidates for a five-year term of office from five local electoral areas by proportional representation with a single transferable vote.
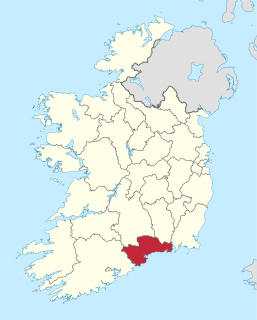
An election to Waterford City and County Council took place on 23 May 2014 as part of that year's Irish local elections. 32 councillors were elected from five electoral divisions by PR-STV voting for a five-year term of office. This is a new local authority which was formed out of a merger from the abolished Waterford City Council and Waterford County Councils. In addition Dungarvan Town Council, Lismore Town Council and Tramore Town Council were also abolished.
A Cork County Council election was held in Ireland on 23 May 2014 as part of that year's local elections. Fifty-five councillors were elected from a field of 114 candidates for a five-year term of office from eight local electoral areas by proportional representation with a single transferable vote.