A Mayo County Council election was held in Ireland on 23 May 2014 as part of that year's local elections. Thirty councillors were elected for a five-year term of office from four local electoral areas by proportional representation with a single transferable vote. [1] [2] [3] This represented a reduction of 1 councillor since 2009 and 1 a reduction in 2 electoral areas.
Mayo County Council is the authority responsible for local government in County Mayo, Ireland. As a county council, it is governed by the Local Government Act 2001. The council is responsible for housing and community, roads and transportation, urban planning and development, amenity and culture, and environment. The council has 30 elected members. Elections are held every five years and are by single transferable vote. The head of the council has the title of Cathaoirleach (Chairperson). The county administration is headed by a Chief Executive, Peter Hynes. The county town is Castlebar.
While Fine Gael remained the most popular party in Mayo in terms of vote share the party surrendered its previously held overall majority on Mayo County Council and lost 7 seats in the process to be reduced to 10 councillors. Several long-serving members lost their seats in the process and the Taoiseach's brother, Henry Kenny, was a near casualty in Castlebar. Fianna Fáil gained 3 seats in the election to return with 10 councillors, the same numbers as Fine Gael. Their gains came in Ballina, Castlebar and in Claremorris. The party missed out on an additional seat in West Mayo due to running too many candidates, transfer leakage and the fact that the previous incumbents had retired. Sinn Féin made modest gains by gaining a seat in Castlebar to add to their delegation, although the party was very close in Ballina. Independents garnered a large vote share in each LEA and increased their numbers to 7 seats.
Party | Seats | ± | 1st pref | FPv% | |
---|---|---|---|---|---|
Fine Gael | 10 | −7 | 21,538 | 34.49 | |
Fianna Fáil | 10 | +3 | 18,286 | 29.28 | |
Independent | 7 | +2 | 15,336 | 24.56 | |
Sinn Féin | 3 | +1 | 6,449 | 10.33 | |
Labour Party | 0 | 0 | 607 | 0.97 | |
Green Party | 0 | 239 | 0.38 | ||
Totals | 30 | −1 | 62,455 | 100% |
Ballina- 8 seats | ||||||||||||||||
---|---|---|---|---|---|---|---|---|---|---|---|---|---|---|---|---|
Party | Candidate | % 1st Pref | Count 1 | Count 2 | Count 3 | Count 4 | Count 5 | Count 6 | Count 7 | Count 8 | Count 9 | Count 10 | Count 11 | Count 12 | Count 13 | |
Fine Gael | John O'Hara* | 9.9% | 1,612 | 1,614 | 1,672 | 1,712 | 1,741 | 1,746 | 1,846 | |||||||
Independent | Seamus Weir* | 9.7% | 1,589 | 1,590 | 1,630 | 1,670 | 1,672 | 1,762 | 1,812 | 1,817 | ||||||
Fianna Fáil | Annie May Raepe* | 7.7% | 1,256 | 1,260 | 1,263 | 1,314 | 1,330 | 1,392 | 1,652 | 1,662 | 1,822 | |||||
Fianna Fáil | Michael Smyth | 6.6% | 1,069 | 1,087 | 1,091 | 1,093 | 1,297 | 1,410 | 1,416 | 1,416 | 1,434 | 1,450 | 1,480 | 1,521 | 1,523 | |
Fine Gael | Jarlath Munnelly* | 6.4% | 1,042 | 1,043 | 1,122 | 1,127 | 1,160 | 1,166 | 1,196 | 1,199 | 1,565 | 1,834 | ||||
Fianna Fáil | Michael Loftus | 6.4% | 1,037 | 1,037 | 1,098 | 1,105 | 1,109 | 1,137 | 1,186 | 1,187 | 1,372 | 1,432 | 2,100 | |||
Sinn Féin | John Sheahan | 6.3% | 1,026 | 1,059 | 1,062 | 1,096 | 1,218 | 1,266 | 1,278 | 1,278 | 1,314 | 1,355 | 1,393 | 1,440 | 1,453 | |
Independent | Enda Lavelle | 6.0% | 980 | 983 | 1,062 | 1,071 | 1,075 | 1,081 | 1,088 | 1,090 | 1,190 | 1,244 | ||||
Independent | Gerry Ginty* | 5.7% | 935 | 938 | 948 | 1,155 | 1,159 | 1,169 | 1,290 | 1,295 | 1,340 | 1,736 | 1,846 | |||
Fianna Fáil | Eamon Moore | 5.5% | 901 | 901 | 987 | 999 | 1,001 | 1,018 | 1,043 | 1,043 | ||||||
Fine Gael | Neil Cruise | 5.2% | 848 | 854 | 871 | 882 | 1,004 | 1,253 | 1,253 | 1,258 | 1,274 | 1,344 | 1,406 | 1,500 | 1,510 | |
Fine Gael | Mark Winters | 5.1% | 830 | 830 | 858 | 909 | 914 | 919 | 1,081 | 1,088 | 1,111 | |||||
Fianna Fáil | Johnnie O'Malley | 4.9% | 798 | 693 | 799 | 808 | 849 | 851 | 872 | |||||||
Fianna Fáil | Jimmy Maloney* | 4.2% | 682 | 685 | 687 | 688 | 709 | |||||||||
Fine Gael | Joe Mellet* | 3.6% | 585 | 609 | 611 | 613 | ||||||||||
Independent | Peter Clarke | 5.2% | 528 | 528 | 530 | |||||||||||
Fine Gael | Padraic Staunton | 2.9% | 486 | 486 | ||||||||||||
Independent | Martin Peyton | 0.7% | 111 | |||||||||||||
Electorate: 26,103 Valid: 16,315 Spoilt: 167 Quota: 1,813 Turnout: 16,482 (63.1%) |
Sources:
Castlebar- 8 seats | |||||||||||
---|---|---|---|---|---|---|---|---|---|---|---|
Party | Candidate | % 1st Pref | Count 1 | Count 2 | Count 3 | Count 4 | Count 5 | Count 6 | Count 7 | Count 8 | |
Independent | Michael Kilcoyne* | 18.9% | 2,922 | ||||||||
Fianna Fáil | Lisa Chambers † | 9.6% | 1,481 | 1,610 | 1,621 | 1,644 | 1,681 | 1,826 | |||
Fianna Fáil | Al McDonnell* | 9.2% | 1,419 | 1,531 | 1,534 | 1,549 | 1,578 | 1,597 | 1,606 | 1,682 | |
Sinn Féin | Thérèse Ruane | 8.9% | 1,375 | 1,517 | 1,539 | 1,581 | 1,607 | 1,719 | |||
Fine Gael | Cyril Burke* | 7.7% | 1,185 | 1,231 | 1,234 | 1,242 | 1,296 | 1,347 | 1,355 | 1,641 | |
Fianna Fáil | K. Blackie Gavin* | 7.3% | 1,127 | 1,263 | 1,265 | 1,293 | 1,341 | 1,415 | 1,438 | 1,539 | |
Independent | Frank Durcan* | 7.1% | 1,100 | 1,345 | 1,366 | 1,419 | 1,464 | 1,562 | 1,585 | 1,664 | |
Fine Gael | Eugene Lavin* | 7.0% | 1,083 | 1,106 | 1,108 | 1,112 | 1,163 | 1,181 | 1,186 | ||
Fine Gael | Henry Kenny* | 7.0% | 1,075 | 1,150 | 1,152 | 1,168 | 1,384 | 1,435 | 1,441 | 1,674 | |
Fine Gael | Brendan Henaghan | 6.1% | 934 | 1,026 | 1,036 | 1,080 | 1,266 | 1,383 | 1,410 | 1,522 | |
Fine Gael | Eugene McCormack | 4.5% | 690 | 736 | 739 | 754 | |||||
Labour Party | Harry Barrett | 3.9% | 606 | 712 | 721 | 759 | 793 | ||||
Independent | Donal Geraghty | 1.7% | 265 | 307 | 324 | ||||||
Independent | Mohammed Kamal Uddin | 0.9% | 132 | 146 | |||||||
Electorate: 26,263 Valid: 15,397 (58.6%) Spoilt: 135 Quota: 1,806 Turnout: 15,532 (59.1%) |
Sources:
Claremorris- 7 seats | |||||||||
---|---|---|---|---|---|---|---|---|---|
Party | Candidate | % 1st Pref | Count 1 | Count 2 | Count 3 | Count 4 | Count 5 | Count 6 | |
Fine Gael | Patsy O'Brien* | 15.1% | 2,347 | ||||||
Independent | Richard Finn* | 13.2% | 2,050 | ||||||
Sinn Féin | Gerry Murray* | 12.7% | 1,971 | ||||||
Fine Gael | John Cribben* | 11.3% | 1,750 | 1,770 | 1,843 | 1,862 | 1,879 | 1,926 | |
Fianna Fáil | John Caulfield | 9.8% | 1,518 | 1,523 | 1,565 | 1,576 | 1,585 | 1,771 | |
Fianna Fáil | Damien Ryan* | 7.3% | 1,250 | 1,319 | 1,336 | 1,339 | 1,697 | 1,913 | |
Fine Gael | Tom Connolly* | 7.1% | 1,203 | 1,263 | 1,331 | 1,369 | 1,396 | 1,823 | |
Fine Gael | Michael Burke* | 7.2% | 1,120 | 1,218 | 1,255 | 1,258 | 1,524 | 1,559 | |
Fianna Fáil | John P. Kean | 6.4% | 1,001 | 1,048 | 1,142 | 1,170 | 1,209 | ||
Independent | Harry Walsh | 5.3% | 826 | 911 | 977 | 982 | |||
Independent | Marie Kilcullen | 2.6% | 403 | 418 | |||||
Green Party | Margaret (Mags) Sheehan | 0.7% | 103 | 108 | |||||
Electorate: 25,099 Valid: 15,542 (61.9%) Spoilt: 177 Quota: 1,943 Turnout: 15,719 (62.6%) |
Sources:
West Mayo- 7 seats | |||||||||||||||
---|---|---|---|---|---|---|---|---|---|---|---|---|---|---|---|
Party | Candidate | % 1st Pref | Count 1 | Count 2 | Count 3 | Count 4 | Count 5 | Count 6 | Count 7 | Count 8 | Count 9 | Count 10 | Count 11 | Count 12 | |
Sinn Féin | Rose Conway-Walsh *†† | 13.7% | 2,075 | ||||||||||||
Independent | Michael Holmes* | 10.9% | 1,667 | 1,701 | 1,714 | 1,747 | 1,867 | 1,919 | |||||||
Fianna Fáil | Paul McNamara | 8.9% | 1,351 | 1,356 | 1,359 | 1,363 | 1,370 | 1,373 | 1,547 | 1,576 | 1,662 | 1,675 | 1,698 | 1,701 | |
Fine Gael | Tereasa McGuire | 6.4% | 1,200 | 1,203 | 1,229 | 1,236 | 1,254 | 1,291 | 1,350 | 1,428 | 1,436 | 1,700 | 2,136 | ||
Fianna Fáil | Seán Carey | 7.9% | 1,197 | 1,250 | 1,251 | 1,254 | 1,255 | 1,257 | 1,264 | 1,299 | 1,508 | 1,515 | 1,530 | 1,533 | |
Fine Gael | Gerry Coyle* | 7.9% | 1,194 | 1,223 | 1,225 | 1,226 | 1,230 | 1,232 | 1,326 | 1,329 | 1,505 | 1,526 | 1,606 | 1,729 | |
Independent | Christy Hyland | 7.6% | 1,160 | 1,167 | 1,186 | 1,210 | 1,232 | 1,281 | 1,295 | 1,370 | 1,378 | 1,580 | 1,892 | 1,979 | |
Fine Gael | Austin O'Malley* | 6.6% | 1,004 | 1,006 | 1,010 | 1,101 | 1,114 | 1,128 | 1,141 | 1,184 | 1,185 | 1,406 | |||
Fianna Fáil | Brendan Mulroy | 5.5% | 913 | 916 | 923 | 943 | 980 | 1,045 | 1,073 | 1,278 | 1,298 | 1,468 | 1,618 | 1,638 | |
Fine Gael | John O'Malley* | 5.5% | 836 | 838 | 846 | 851 | 885 | 933 | 968 | 1,011 | 1,019 | ||||
Fianna Fáil | Frank Leneghan | 4.6% | 544 | 558 | 558 | 559 | 566 | 568 | 618 | 630 | |||||
Fine Gael | Breege Grealis | 3.4% | 511 | 517 | 525 | 525 | 540 | 545 | |||||||
Fianna Fáil | Joan Geraghty | 3.2% | 486 | 489 | 546 | 558 | 585 | 592 | → | ||||||
Independent | Joe Lavelle | 2.2% | 337 | 340 | 354 | 357 | 374 | ||||||||
Independent | Michael O'Donnell | 2.2% | 331 | 336 | 346 | ||||||||||
Fianna Fáil | Tommie Joe Jennings | 1.7% | 257 | 258 | 260 | ||||||||||
Green Party | Caroline Fitzgerald | 0.9% | 136 | 141 | |||||||||||
Electorate: 24,947 Valid: 15,199 Spoilt: 152 Quota: 1,900 Turnout: 15,351 (61.53%) |
Sources:
An election to Monaghan County Council took place on 23 May 2014 as part of that year's Irish local elections. 18 councillors were elected from three electoral divisions by PR-STV voting for a five-year term of office, a reduction of 2 seats compared to 2009. Monaghan also saw a further reduction in elected representation as Ballybay Town Council, Carrickmacross Town Council, Castleblayney Town Council, Clones Town Council and Monaghan Town Council were all abolished.
An election to Donegal County Council took place on 23 May 2014 as part of that year's Irish local elections. 37 councillors were elected from five electoral divisions by PR-STV voting for a five-year term of office. In addition Ballyshannon Town Council, Bundoran Town Council and Letterkenny Town Council were all abolished.
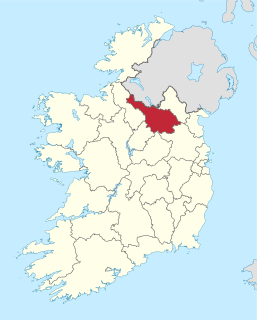
An election to Cavan County Council took place on 23 May 2014 as part of that year's Irish local elections. 18 councillors were elected from three electoral divisions by PR-STV voting for a five-year term of office. In addition both Belturbet Town Council and Cavan Town Council were abolished.
An election to Galway County Council took place on 23 May 2014 as part of that year's Irish local elections. 39 councillors were elected from five electoral divisions by PR-STV voting for a five-year term of office, an increase in 9 seats from 2009. In addition Ballinasloe Town Council, Loughrea Town Council and Tuam Town Council were all abolished.
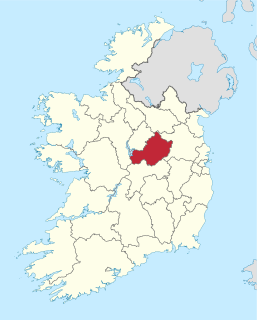
An election to Westmeath County Council took place on 23 May 2014 as part of that year's Irish local elections. 20 councillors were elected from three electoral divisions by PR-STV voting for a five-year term of office, a reduction of 3 seats compared to 2009. In addition Athlone Town Council and Mullingar Town Council were both abolished.
An election to Meath County Council took place on 23 May 2014 as part of that year's Irish local elections. 40 councillors were elected from six electoral divisions by PR-STV voting for a five-year term of office, an increase of 11 seats from 2009.
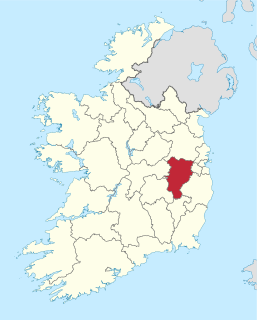
An election to Kildare County Council took place on 23 May 2014 as part of that year's Irish local elections. 40 councillors were elected from five electoral divisions by PR-STV voting for a five-year term of office, an increase in 15 seats compared to 2009. In addition Athy Town Council, Leixlip Town Council, Naas Town Council and Newbridge Town Council were all abolished.
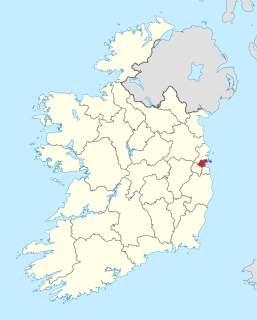
A Dublin City Council election was held in Ireland on 23 May 2014 as part of that year's local elections. Sixty-three councillors were elected for a five-year term of office from nine local electoral areas by proportional representation with a single transferable vote.
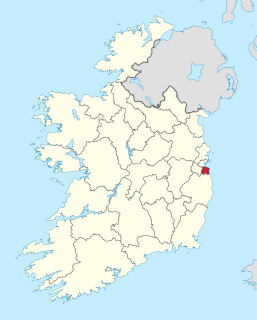
A Dún Laoghaire–Rathdown County Council election was held in Ireland on 23 May 2014 as part of that year's local elections. Forty councillors were elected from a field of 85 candidates for a five-year term of office from six local electoral areas by proportional representation with a single transferable vote.
A Fingal County Council election was held in Ireland on 23 May 2014 as part of that year's local elections. Forty councillors were elected from a field of 97 candidates for a five-year term of office from five local electoral areas by proportional representation with a single transferable vote.
An election to South Dublin County Council took place on 23 May 2014 as part of that year's Irish local elections. Forty councillors were elected from six local electoral areas by proportional representation with a single transferable vote for a five-year term of office.
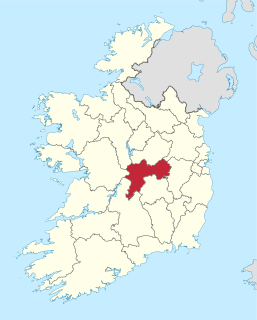
An election to Offaly County Council took place on 23 May 2014 as part of that year's Irish local elections. 19 councillors were elected from three electoral divisions by PR-STV voting for a five-year term of office, a reduction of 2 seats from the previous election in 2009. In addition Birr Town Council, Edenderry Town Council and Tullamore Town Council were all abolished.
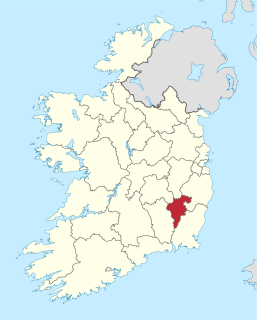
An election to Carlow County Council took place on 23 May 2014 as part of that year's Irish local elections. 18 councillors were elected from two electoral divisions by PR-STV voting for a five-year term of office. Ahead of the 2014 election Carlow was redrawn into two electoral areas, a reduction in three from five, and the number of councillors was reduced to 18, from a previous total of 21. Carlow Town Council and Muinebheag Town Council were both abolished.
An election to Wexford County Council took place on 23 May 2014 as part of that year's Irish local elections. 34 councillors were elected from three electoral divisions by PR-STV voting for a five-year term of office, an increase of 13 seats from the previous election in 2009. In addition the Wexford Borough Council, Enniscorthy Town Council, Gorey Town Council and New Ross Town Council were all abolished.
An election to Wicklow County Council took place on 23 May 2014 as part of that year's Irish local elections. 32 councillors were elected from five electoral divisions by PR-STV voting for a five-year term of office, an increase of 8 seats from the previous election in 2009. In addition Arklow Town Council, Bray Town Council, Greystones Town Council and Wicklow Town Council were all abolished, as per the Local Government Reform Act 2014.
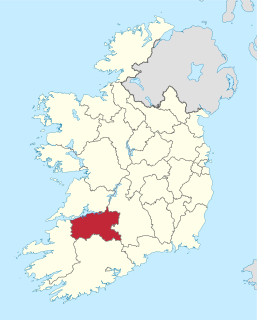
An election to Limerick City and County Council took place on 23 May 2014 as part of that year's Irish local elections. 40 councillors were elected from six electoral divisions by PR-STV voting for a five-year term of office. This is a new local authority which was formed out of a merger from the abolished Limerick City Council and Limerick County Councils.
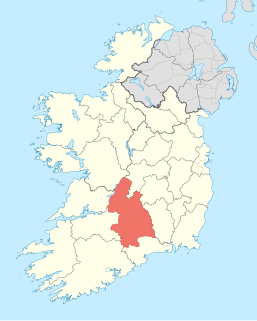
A Tipperary County Council election was held in Ireland on 23 May 2014 as part of that year's local elections. Forty councillors were elected from a field of 85 candidates for a five-year term of office from five local electoral areas by proportional representation with a single transferable vote.
An election to Kerry County Council took place on 23 May 2014 as part of that year's Irish local elections. 33 councillors were elected from four local electoral areas (LEAs) by PR-STV voting for a five-year term of office. This is a reduction of LEA and an increase in 6 seats compared to 2009. In addition Killarney Town Council, Listowel Town Council and Tralee Town Council were all abolished.
A Cork County Council election was held in Ireland on 23 May 2014 as part of that year's local elections. Fifty-five councillors were elected from a field of 114 candidates for a five-year term of office from eight local electoral areas by proportional representation with a single transferable vote.
A by-election was held in the Dáil Éireann Carlow–Kilkenny constituency in Ireland on Friday, 22 May 2015, to fill the vacancy left by the resignation of Fine Gael Teachta Dála (TD) Phil Hogan on his appointment as European Commissioner. It was held on the same day as national referendums on marriage equality and the age of eligibility for election to the office of president. The Electoral (Amendment) Act 2011 stipulates that a by-election in Ireland must be held within six months of a vacancy occurring. The by-election writ was moved in the Dáil on 29 April 2015.