Limerick City and County Council election, 2014

Last updated
Limerick City and County Council election, 2014
Flag of Ireland.svg
23 May 20142019 

All 40 seats to Limerick City and County Council

  First party Second party Third party
 
Party Fianna Fáil Fine Gael Sinn Féin
Seats won13126

  Fourth party Fifth party Sixth party
 
Party Labour Party Anti-Austerity Alliance Independent
Seats won333

Limerick in Ireland.svg

Map showing the area of Limerick City and County Council

Council control before election

Fine Gael
Labour Party

Council control after election

Fine Gael
Labour Party

An election to Limerick City and County Council took place on 23 May 2014 as part of that year's Irish local elections. 40 councillors were elected from six electoral divisions by PR-STV voting for a five-year term of office. This is a new local authority which was formed out of a merger from the abolished Limerick City Council and Limerick County Councils.

Limerick City and County Council

Limerick City and County Council is the authority responsible for local government in the City of Limerick and County Limerick in Ireland. It came into operation on 1 June 2014 after the 2014 local elections. It was formed by the merger of Limerick City Council and Limerick County Council under the provisions of the Local Government Reform Act 2014. The city and county administration is headed by a Chief Executive, Conn Murray. The administrative centre is Limerick.

Limerick City Council

Limerick City Council was the authority responsible for local government in the city of Limerick in Ireland. The council had 17 elected members. The head of the council had the title of Mayor. Limerick City Council was the smallest local council in Ireland by area (20.35 km²) and 30th in terms of population. It was abolished in 2014 when the Local Government Reform Act 2014 was implemented. It was succeeded by Limerick City and County Council.

Contents

Significantly Fianna Fáil emerged as the largest party on the Council after the elections despite being 3,838 first preference votes behind Fine Gael. The party won seats in Limerick city, historically a weak area for them in local elections. Its best results were in Cappaghmore-Kilmallock and Limerick City East where they secured 3 seats in each LEA. Fine Gael were disadvantaged by the merger of the 2 local authorities as they held many councillors on the old City Council and several of these Councillors were defeated under the new boundaries. However, the party won 3 seats in Newcastle West. It was a very poor election for Labour as they just returned 1 seat in each of the 3 city LEAs just as did the Anti-Austerity Alliance. Sinn Féin sent a delegation of 6 councillors back to the new chamber to join their existing member Maurice Quinlivan. Independents secured the remaining 3 seats, 1 of which was Emmett O'Brien a former member of the Fianna Fáil National Executive. [1] [2] After the elections 4 of the Fianna Fáil members broke away to form an independent block over an internal disagreement over who should secure the Chairmanship of the Council. This was later resolved after intercession by Party Headquarters and they rejoined the Fianna Fáil grouping. [3]

Results by party

PartySeats±First Pref. votesFPv%±%
Fianna Fáil 1319,68027.4%
Fine Gael 1223,51832.7%
Sinn Féin 69,29812.9%
Labour Party 34,7606.6%
Anti-Austerity Alliance 33,1364.4%
Independent 311,45615.9%
Totals40100%

Results by Electoral Area

Adare-Rathkeale

Adare-Rathkeale - 6 seats
Party Candidate % 1st Pref Count 1 Count 2Count 3Count 4Count 5Count 6Count 7Count 8
Independent Emmett O'Brien 18.4%2,270       
Fine Gael Tom Neville ††††† 15.2%1,873       
Fine Gael Stephen Keary* 13.7% 1,6881,761 1,800     
Fianna Fáil Kevin Sheahan* 9.9% 1,2291,334 1,3431,3661,4441,6181,6211,749
Sinn Féin Ciara McMahon 8.3% 1,0271,110 1,1181,2471,3021,3601,3611,527
Fianna Fáil Richard O'Donoghue†† 7.4% 912942 9499631,2241,4451,4491,718
Fianna Fáil James Cavanagh 6.3% 777813 819831891   
Fine Gael Rose Brennan* 6.2% 766811 8408679401,1381,1561,375
Fianna Fáil Séamus Sheahan 5.9% 736749 753772    
Independent Patrick Fitzgerald* 5.7% 704783 7898881,0551,1441,146 
Anti-Austerity Alliance Kathleen Enright 2.8% 350394 397     
Electorate: 23,045  Valid: 12,332  Spoilt: 118  Quota: 1,762  Turnout: 12,450 (54.02%)

    Cappamore-Kilmallock

    Cappamore-Kilmallock- 7 seats
    Party Candidate % 1st Pref Count 1 Count 2Count 3Count 4Count 5Count 6
    Independent Brigid Teefy* 16.04%2,369     
    Fianna Fáil Eddie Ryan* 14.7%2,178     
    Sinn Féin Lisa-Marie Sheehy†††††††† 12.8%1,889     
    Fianna Fáil Noel Gleeson* 9.5% 1,3991,488 1,5541,5591,893 
    Fianna Fáil Mike Donegan* 9.1% 1,3391,374 1,4671,4741,5481,825
    Fine Gael Gerard Mitchell 8.6% 1,2721,367 1,4261,4301,5251,713
    Fine Gael John Egan* 7.9% 1,1651,242 1,2511,2541,3551,509
    Fine Gael William O'Donnell* 7.5% 1,1081,186 1,2241,2271,2711,669
    Fine Gael Mike Houlihan* 7.3% 1,0711,101 1,1411,1481,208 
    Independent Joe Meagher 6.7% 9821,100 1,1251,139  
    Electorate: 27,485  Valid: 14,772  Spoilt: 187  Quota: 1,847  Turnout: 14,959 (54.4%)

      Limerick City East

      Limerick City East - 8 seats
      Party Candidate % 1st Pref Count 1 Count 2Count 3Count 4Count 5Count 6Count 7Count 8Count 9Count 10Count 11Count 12Count 13Count 14Count 15
      Sinn Féin Seighin O Ceallaigh 14.3%1,703              
      Fianna Fáil Shane Clifford††† 11.2%1,338              
      Fianna Fáil Kieran O'Hanlon* 8.2% 975995 9991,0201,0471,0731,1321,1961,2571,350     
      Fine Gael Michael Sheahan* 7.7% 924929 9309309329411,0091,0151,0241,1081,1091,1131,1131,1151,312
      Labour Party Elena Secas 7.3% 867878 8789389439721,0201,0291,0641,1391,1431,1621,1641,1651,229
      Fine Gael Marian Hurley 6.5% 772775 7757777817888668749169909929949959961,200
      Fine Gael Leo Walsh* 5.9% 709713 721723725733745758782851851860860861 
      Fianna Fáil Jerry O'Dea 5.2% 619636 6416586696917607928629179259539559591,113
      Anti-Austerity Alliance Paul Keller 4.5% 540614 6186316767077187818238468471,345   
      Fine Gael Diarmuid Scully* 4.2% 499506 506514519533542583659      
      Independent Sarah Jane Hennelly 3.9% 467484 487492543629651714752789791856868869911
      Fianna Fáil Joe Pond 3.8% 455463 464467469469         
      Anti-Austerity Alliance Derek Towell 3.7% 442536 538552587624637673716758762    
      Fine Gael Sarah Lee Kiely 3.6% 427445 449472495529535554       
      Independent Jim Hickey 3.2% 384400 400409447482491        
      Independent Orla McLoughlin* 2.6% 313345 350370388          
      Independent Noel Hannon 1.9% 236268 274295           
      Labour Party Derek Mulcahy 1.9% 234243 243            
      Independent Richie Smith 0.4% 4351              
      Electorate: 27,654  Valid: 11,947  Spoilt: 167  Quota: 1,328  Turnout: 12,114 (43.8%)

        Limerick City North

        Limerick City North- 6 seats
        Party Candidate % 1st Pref Count 1 Count 2Count 3Count 4Count 5Count 6Count 7Count 8Count 9Count 10Count 11
        Sinn Féin Maurice Quinlivan *†††††† 24.5%2,456          
        Fine Gael Michael Hourigan* 12.4% 1,2491,278 1,2811,2941,3011,3411,3481,4261,628  
        Labour Party Frankie Daly 10.1% 1,0141,179 1,1951,2011,2251,2891,3031,3361,3981,454 
        Fianna Fáil Joe Crowley†††† 10.1% 1,0141,053 1,0571,0651,0751,0851,2001,2511,2841,2961,362
        Anti-Austerity Alliance Cian Prendeville 9.6% 9641,277 1,2881,3121,3501,3681,3931,4231,448  
        Independent John Gilligan * 8.3% 8311,036 1,0451,0601,1001,1161,1561,2071,2651,2881,446
        Independent Gerry McLoughlin* 4.99% 501569 584600623644664703740753880
        Fine Gael Denis McCarthy* 4.3% 430440 445446457488512525   
        Labour Party Tom Shortt* 4.2% 426456 456462472489504535578618 
        Independent Desmond Hayes 3.3% 334349 354368383391397    
        Fianna Fáil Christy McInerney 2.7% 268289 289289293297     
        Fine Gael Tina O'Gorman 1.9% 195233 242243258      
        Independent Frank Ryan 1.7% 169213 214235       
        Independent Denis Riordan 1.2% 125139 139        
        Independent Patrick McCarthy 0.7% 6593          
        Electorate: 20,980  Valid: 10,041  Spoilt: 150  Quota: 1,435  Turnout: 10,191 (48.6%)

          Limerick City West

          Limerick City West - 7 seats
          Party Candidate % 1st Pref Count 1 Count 2Count 3Count 4Count 5Count 6Count 7Count 8Count 9Count 10Count 11Count 12Count 13
          Fianna Fáil James Collins* 14.9%1,445            
          Fine Gael Maria Byrne*††††††† 14.1%1,370            
          Labour Party Joe Leddin* 14.1% 1,1541,176 1,2081,213         
          Sinn Féin Malachy McCreesh 9.8% 952960 9639639689829921,0291,0431,0731,0971,1491,191
          Fine Gael Daniel Butler* 7.4% 721748 7908098248278418609741,0361,1791,247 
          Anti-Austerity Alliance John Loftus 6.6% 642650 654656670698722761770800821938991
          Fianna Fáil Seán Lynch 5.4% 519576 581583586599605614630653669701919
          Fine Gael Fergus Kilcoyne 5.3% 516526 541548550569575579628654692713771
          Fianna Fáil Geraldine Leddin 4.1% 394458 469473481483492500515554592619 
          Labour Party Tomás Hannon* 3.8% 369382 388390394394408416440461   
          Independent Richie Ryan 3.3% 319325 328338351371393469477502541  
          Fine Gael Jim Long* 3.1% 300303 315320325330332341364    
          Fine Gael Felim Cronin 2.8% 275279 290295297299300302     
          Independent Cathal McCarthy 2.02% 196198 199200211236265      
          Independent Sunny Martins Duruagwu 1.9% 183186 188190205215       
          Independent Jason Griffin 1.5% 144145 146161161        
          Independent Gerry Casey 1.3% 124127 131131         
          Fine Gael Frank Mulqueen 0.7% 6366 73          
          Electorate: 20,242  Valid: 9,686  Spoilt: 98  Quota: 1,211  Turnout: 9,784 (48.3%)

            Newcastle West

            Newcastle West - 6 seats
            Party Candidate % 1st Pref Count 1 Count 2Count 3Count 4Count 5Count 6Count 7
            Fine Gael Jerome Scanlan* 18.3%2,396      
            Fine Gael Liam Galvin* 13.7% 1,7951,860 1,888    
            Fianna Fáil Michael J. Collins* 12.9% 1,6821,772 1,905    
            Sinn Féin Séamus Browne 9.7% 1,2711,296 1,3901,3941,4671,6741,814
            Fianna Fáil Francis Foley* 8.5% 1,1121,144 1,1881,2011,2791,4001,772
            Fine Gael John Sheahan* 7.9% 1,0271,077 1,0961,0971,1921,2631,556
            Fianna Fáil Seamus Ahern 7.2% 941947 9879971,0901,148 
            Fine Gael Damien Riedy* 6.9% 9071,057 1,0941,0981,2771,3661,429
            Labour Party Stephen Goulding 5.3% 696729 756759   
            Independent Christy Kelly 4.99% 652677 793795884  
            Fianna Fáil John Leahy 2.7% 348391      
            Anti-Austerity Alliance Joe Harrington 1.5% 198205      
            Independent Seán O'Mahony 0.3% 4547      
            Electorate: 21,891  Valid: 13,070  Spoilt: 143  Quota: 1,868  Turnout: 13,213 (60.4%)

              Related Research Articles

              2014 Monaghan County Council election

              An election to Monaghan County Council took place on 23 May 2014 as part of that year's Irish local elections. 18 councillors were elected from three electoral divisions by PR-STV voting for a five-year term of office, a reduction of 2 seats compared to 2009. Monaghan also saw a further reduction in elected representation as Ballybay Town Council, Carrickmacross Town Council, Castleblayney Town Council, Clones Town Council and Monaghan Town Council were all abolished.

              2014 Cavan County Council election

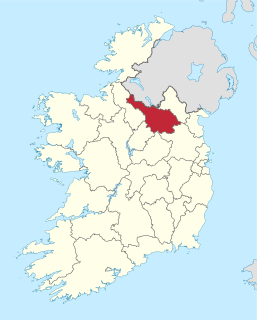
              An election to Cavan County Council took place on 23 May 2014 as part of that year's Irish local elections. 18 councillors were elected from three electoral divisions by PR-STV voting for a five-year term of office. In addition both Belturbet Town Council and Cavan Town Council were abolished.

              2014 Galway County Council election

              An election to Galway County Council took place on 23 May 2014 as part of that year's Irish local elections. 39 councillors were elected from five electoral divisions by PR-STV voting for a five-year term of office, an increase in 9 seats from 2009. In addition Ballinasloe Town Council, Loughrea Town Council and Tuam Town Council were all abolished.

              2014 Galway City Council election

              An election to Galway City Council took place on 23 May 2014 as part of that year's Irish local elections. 18 councillors were elected from three electoral divisions by PR-STV voting for a five-year term of office, an increase of 3 seats when compared to 2009.

              2014 Louth County Council election

              An election to Louth County Council took place on 23 May 2014 as part of that year's Irish local elections. 29 councillors were elected from four electoral divisions by PR-STV voting for a five-year term of office. Ahead of the 2014 election Louth was redrawn into four electoral areas, a reduction of one from five, and the number of councillors was increased to 29, from a previous total of 26. Drogheda Borough Council, Dundalk Town Council and Ardee Town Council were all abolished.

              2014 Westmeath County Council election

              An election to Westmeath County Council took place on 23 May 2014 as part of that year's Irish local elections. 20 councillors were elected from three electoral divisions by PR-STV voting for a five-year term of office, a reduction of 3 seats compared to 2009. In addition Athlone Town Council and Mullingar Town Council were both abolished.

              2014 Meath County Council election

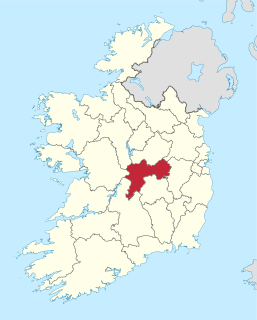
              An election to Meath County Council took place on 23 May 2014 as part of that year's Irish local elections. 40 councillors were elected from six electoral divisions by PR-STV voting for a five-year term of office, an increase of 11 seats from 2009.

              2014 Kildare County Council election

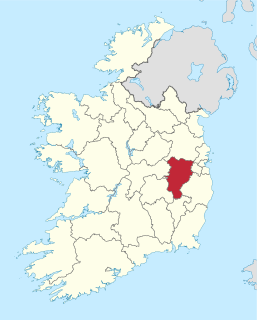
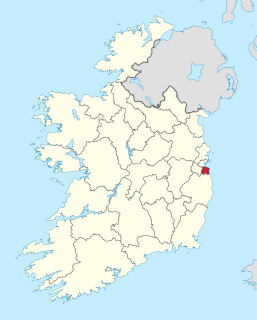
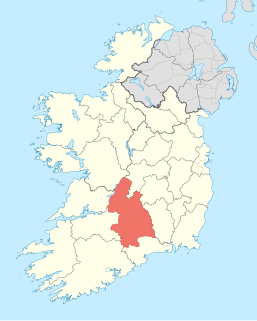
              An election to Kildare County Council took place on 23 May 2014 as part of that year's Irish local elections. 40 councillors were elected from five electoral divisions by PR-STV voting for a five-year term of office, an increase in 15 seats compared to 2009. In addition Athy Town Council, Leixlip Town Council, Naas Town Council and Newbridge Town Council were all abolished.

              2014 Dublin City Council election

              A Dublin City Council election was held in Ireland on 23 May 2014 as part of that year's local elections. Sixty-three councillors were elected for a five-year term of office from nine local electoral areas by proportional representation with a single transferable vote.

              2014 Dún Laoghaire–Rathdown County Council election

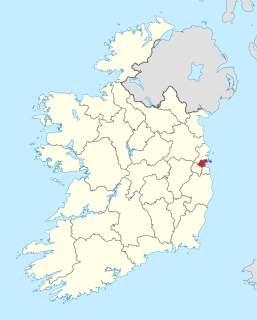
              A Dún Laoghaire–Rathdown County Council election was held in Ireland on 23 May 2014 as part of that year's local elections. Forty councillors were elected from a field of 85 candidates for a five-year term of office from six local electoral areas by proportional representation with a single transferable vote.

              2014 South Dublin County Council election

              An election to South Dublin County Council took place on 23 May 2014 as part of that year's Irish local elections. Forty councillors were elected from six local electoral areas by proportional representation with a single transferable vote for a five-year term of office.

              2014 Mayo County Council election

              A Mayo County Council election was held in Ireland on 23 May 2014 as part of that year's local elections. Thirty councillors were elected for a five-year term of office from four local electoral areas by proportional representation with a single transferable vote. This represented a reduction of 1 councillor since 2009 and 1 a reduction in 2 electoral areas.

              2014 Offaly County Council election

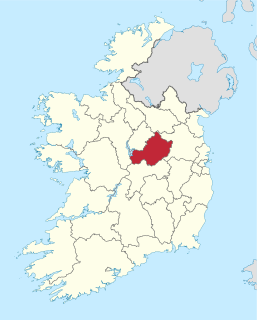
              An election to Offaly County Council took place on 23 May 2014 as part of that year's Irish local elections. 19 councillors were elected from three electoral divisions by PR-STV voting for a five-year term of office, a reduction of 2 seats from the previous election in 2009. In addition Birr Town Council, Edenderry Town Council and Tullamore Town Council were all abolished.

              2014 Kilkenny County Council election

              An election to Kilkenny County Council took place on 23 May 2014 as part of that year's Irish local elections. 24 councillors were elected from three electoral divisions by PR-STV voting for a five-year term of office, a reduction of 2 seats from the previous election in 2009. In addition the Kilkenny Borough Council was abolished.

              2014 Carlow County Council election

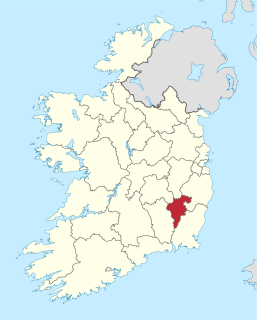
              An election to Carlow County Council took place on 23 May 2014 as part of that year's Irish local elections. 18 councillors were elected from two electoral divisions by PR-STV voting for a five-year term of office. Ahead of the 2014 election Carlow was redrawn into two electoral areas, a reduction in three from five, and the number of councillors was reduced to 18, from a previous total of 21. Carlow Town Council and Muinebheag Town Council were both abolished.

              2014 Wexford County Council election

              An election to Wexford County Council took place on 23 May 2014 as part of that year's Irish local elections. 34 councillors were elected from three electoral divisions by PR-STV voting for a five-year term of office, an increase of 13 seats from the previous election in 2009. In addition the Wexford Borough Council, Enniscorthy Town Council, Gorey Town Council and New Ross Town Council were all abolished.

              2014 Wicklow County Council election

              An election to Wicklow County Council took place on 23 May 2014 as part of that year's Irish local elections. 32 councillors were elected from five electoral divisions by PR-STV voting for a five-year term of office, an increase of 8 seats from the previous election in 2009. In addition Arklow Town Council, Bray Town Council, Greystones Town Council and Wicklow Town Council were all abolished, as per the Local Government Reform Act 2014.

              2014 Tipperary County Council election

              A Tipperary County Council election was held in Ireland on 23 May 2014 as part of that year's local elections. Forty councillors were elected from a field of 85 candidates for a five-year term of office from five local electoral areas by proportional representation with a single transferable vote.

              2014 Waterford City and County Council election

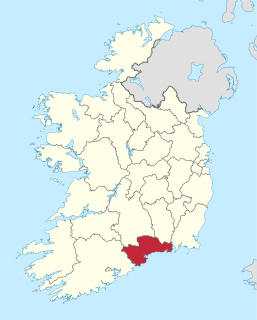
              An election to Waterford City and County Council took place on 23 May 2014 as part of that year's Irish local elections. 32 councillors were elected from five electoral divisions by PR-STV voting for a five-year term of office. This is a new local authority which was formed out of a merger from the abolished Waterford City Council and Waterford County Councils. In addition Dungarvan Town Council, Lismore Town Council and Tramore Town Council were also abolished.

              2014 Cork County Council election

              A Cork County Council election was held in Ireland on 23 May 2014 as part of that year's local elections. Fifty-five councillors were elected from a field of 114 candidates for a five-year term of office from eight local electoral areas by proportional representation with a single transferable vote.

              References

              1. "Limerick City and County Council finalised". Limerick Leader. 26 May 2014. Retrieved 8 June 2014.
              2. "Limerick City and County Council results". Irish Independent. 24 June 2014. Retrieved 15 June 2014..
              3. "Limerick City and County Council dispute resolved". Irish Times. 1 June 2014. Retrieved 15 June 2014..

              Changes since 2014

              Preceded by
              Limerick City Council election, 2009
              Limerick County Council election, 2009
              Limerick City and County County Council elections Succeeded by
              Limerick City and County Council election, 2019